


Rotation Slows


Issue 81;
- Bond yields keep rising
- Mixed outlook in Latin America
- Rotation slows
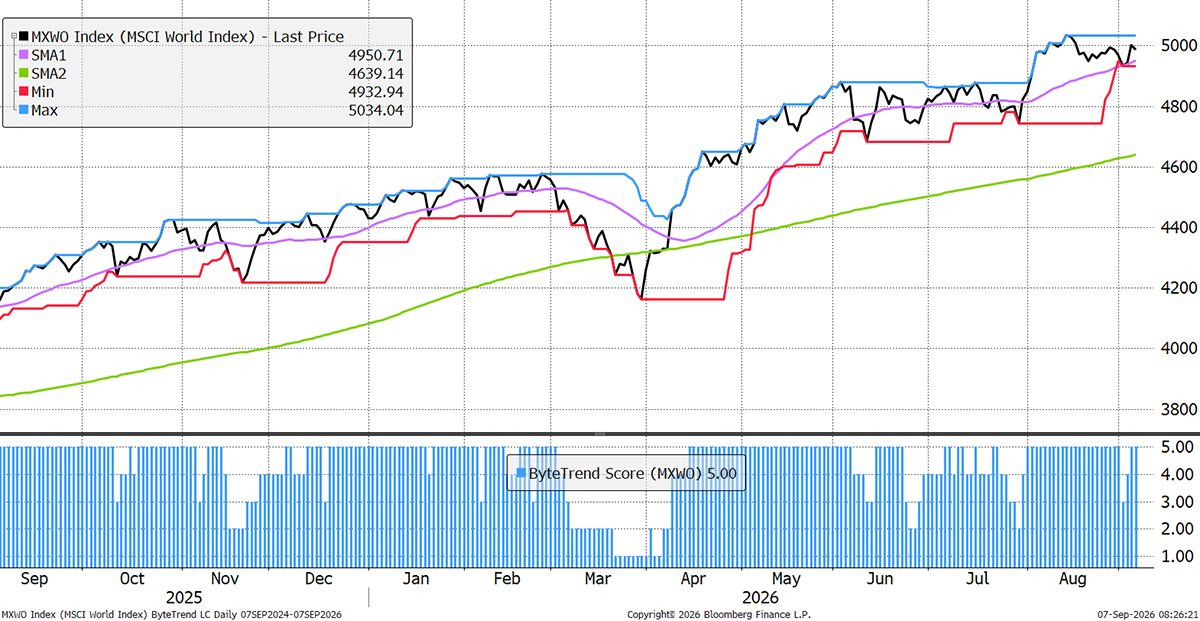
The World Index returns to a ByteTrend Score of 5 in USD but has not yet made a new all-time high. Dollar weakness is a supportive factor.
World Index – Developed Markets – Daily
US Bond Yields
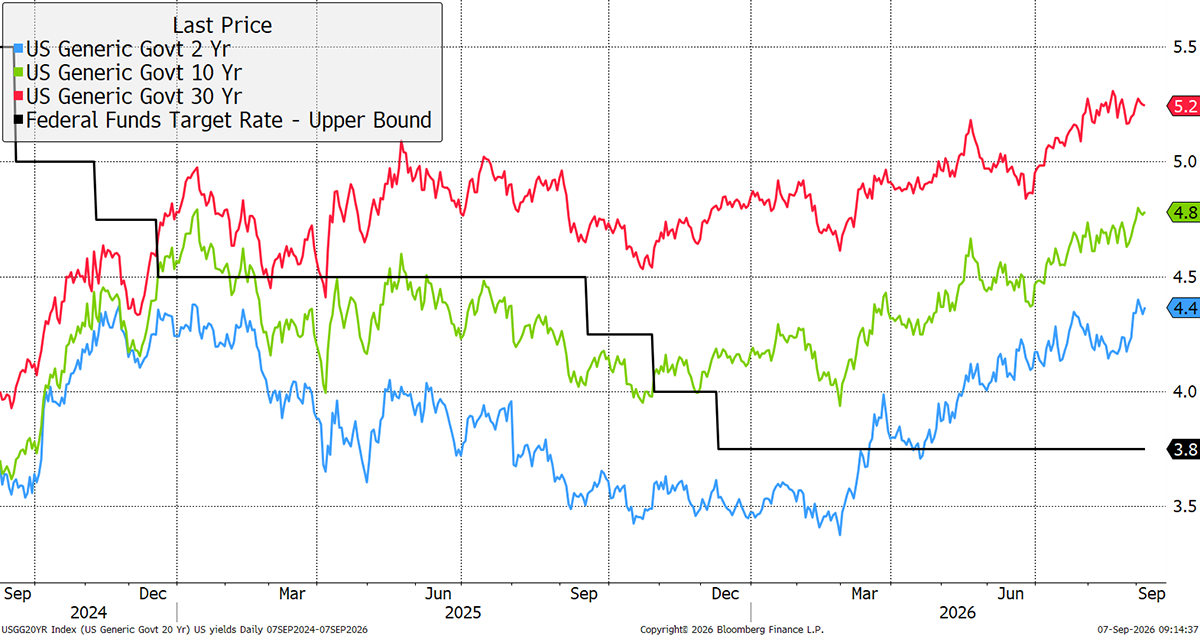
Recently, the 30-year yield was deemed too high, so the authorities intervened. When that happened, the two- and ten-year yields rose. Some, like the financial establishment, believe that yields are behaving normally and reflect the high level of growth in nominal GDP. Others, the financial pirates such as active investors, think the quantity of debt is at dangerous levels. We will only find out the answer if and when bond yields start to fall in the next recession. If they don’t, the pirates have it.
Net Winners in CAPR
The winners-less-losers metric guides asset allocators. Technology and financial services dominate market leadership. Rate-sensitive sectors are light.

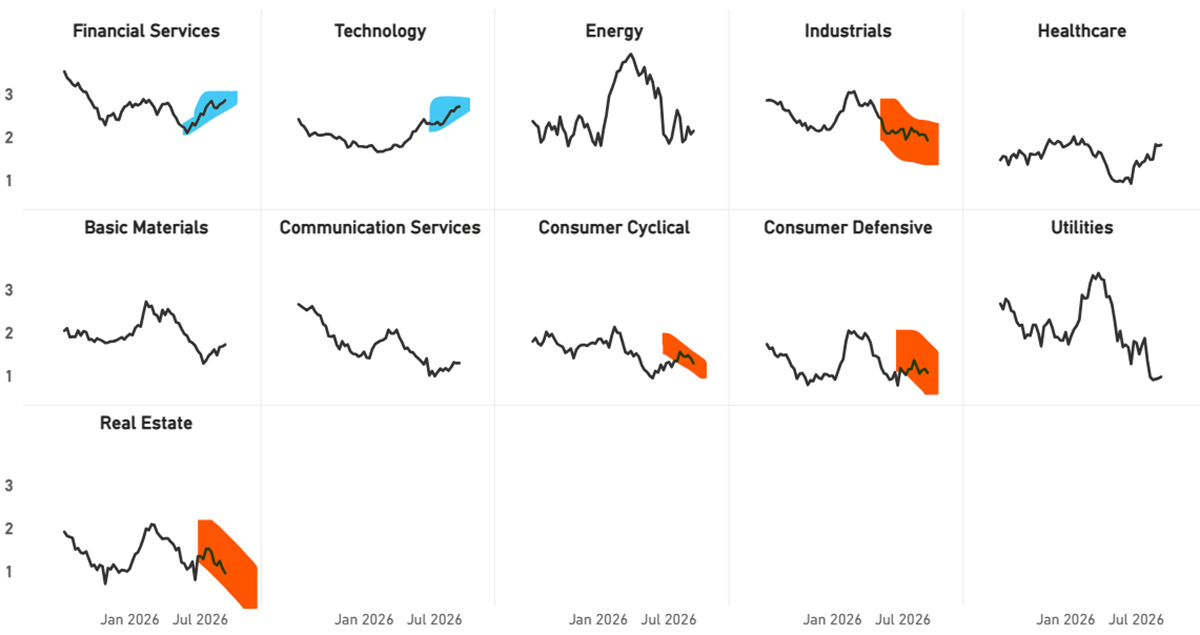
Global Sectors Average Trend Score
That sector has strengthened over the past week. More notable is the renewed weakness in industrials. The consumer and real estate have been weak alongside bonds.
Americas by Country - Average Trend Score
Brazil has been weak on fears of higher US rates. More recently, the election polls have weakened Lula’s chances, which has been well received. While Brazil has bounced, Mexico has seen market breadth deteriorate. Fears remain over US trade, Pemex credit concerns, and weak growth, but there is no smoking gun.

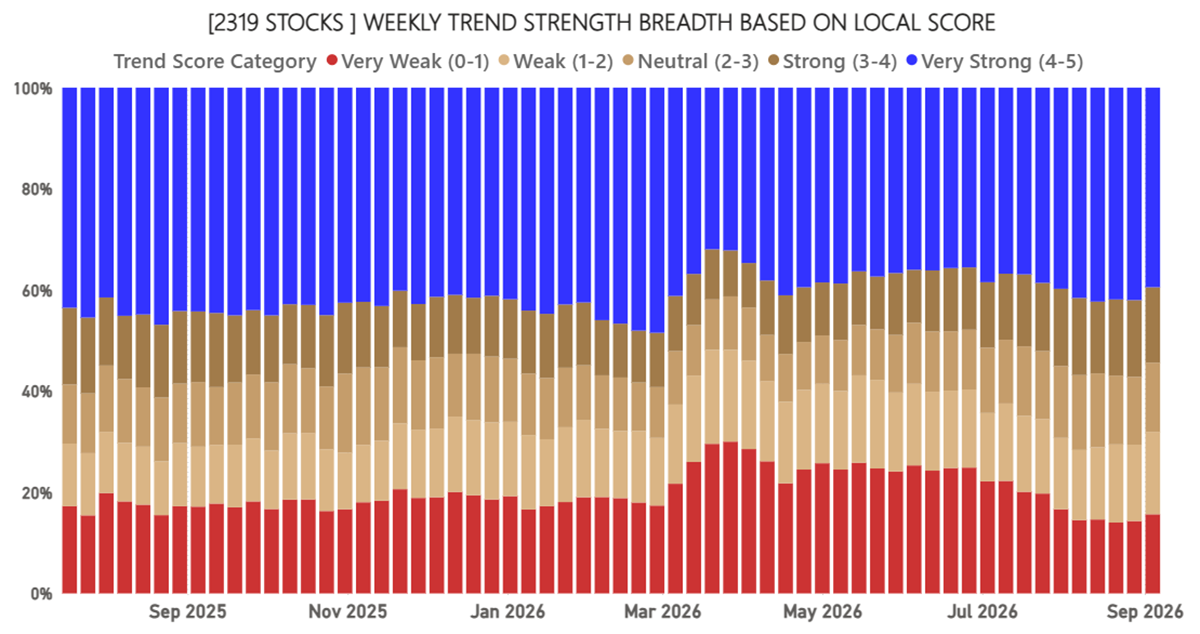
Global Market Breadth – Local Currency
Breadth has weakened for two weeks in a row, bearing in mind it is September, which is the traditional correction season. This may be a cause for concern, but it is too early to tell.
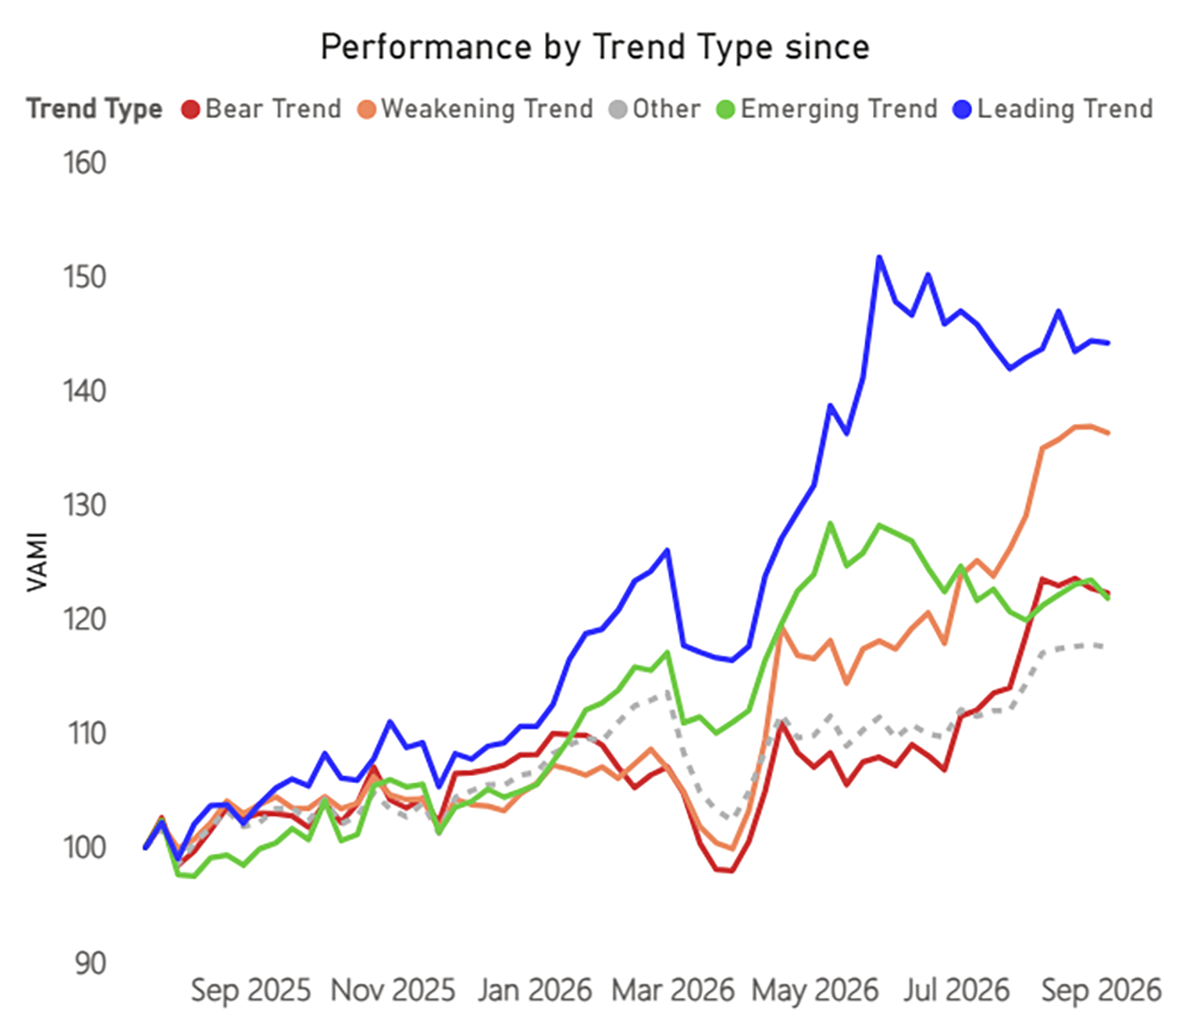
Performance by Trend Type
The market rotation has slowed. The leaders' underperformance is nearly complete, while the bounce in weakening and bear is likely done. Recall that the leaders are only leaders while they meet the criteria for trends and relative highs. As soon as they stop leading, they are no longer being measured. It is a dynamic group of stocks.
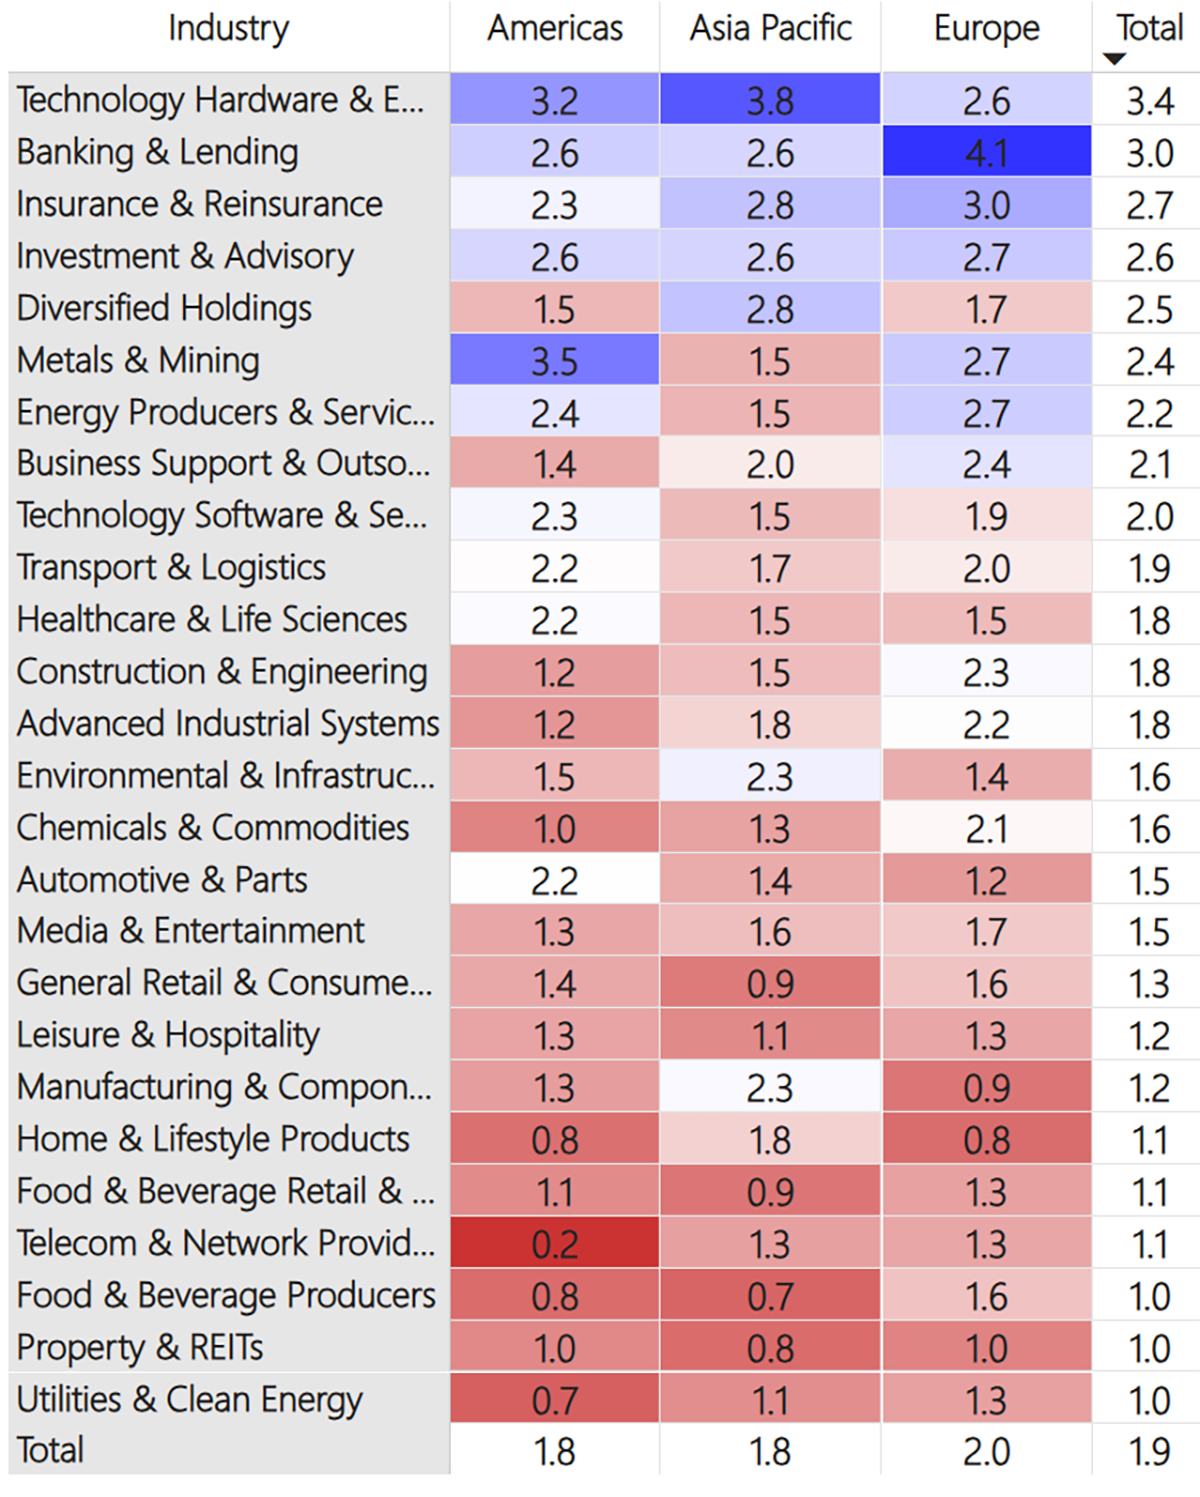
Regions and Industries Average Relative Score
This table (below) shows the average CAPR score for each global industry, by region and in total.
Banking picked up again last week, following a quieter period, while investment stocks pulled back slightly. Metals & Mining are surging as the gold bull market returns, and Energy stocks remain strong as the Hormuz crisis drags on.
The table has been largely unchanged for some time, with Software’s rise up the ranks and Utilities’ fall as rare exceptions.
General Retail stocks are showing weakness, as the likes of Walmart and Costco pull back from record valuations. Leisure and Hospitality stocks are also weak and getting weaker, and Expedia is the only stock in that industry with a CAPR score of 5, while 24 stocks have a score of 0. Property and REITs are also fading again as higher oil prices push interest rates higher.
User Guide
Refer to our GTI: User Guide for an overview of the key concepts and terminology used in this report. These concepts may take a little bit of getting used to, but they are very powerful once you do.
Leading Trends with New Highs
These stocks are trading at the 30-week CAPR highs with a ByteTrend Score of 5. All charts shown are CAPR rebased to 100.
| Name | Annual Vol 30w | Mkt Cap $Bn | Industry |
| Dell Technologies Inc. | 82 | 348 | Technology Hardware & Equipment |
| Mitsubishi UFJ Financial Group, Inc. | 27 | 273 | Banking & Lending |
| Banco Santander, S.A. | 31 | 219 | Banking & Lending |
| UBS Group AG | 24 | 181 | Banking & Lending |
| DBS Group Holdings Ltd | 15 | 176 | Banks |
| Banco Bilbao Vizcaya Argentaria, S.A. | 27 | 163 | Banking & Lending |
| Mizuho Financial Group, Inc. | 34 | 137 | Banking & Lending |
| Snowflake Inc. | 81 | 117 | Technology Software & Services |
| Oversea-Chinese Banking Corporation Limited | 19 | 114 | Banking & Lending |
| The Bank of Nova Scotia | 21 | 114 | Banking & Lending |
| Marathon Petroleum Corporation | 43 | 114 | Energy Producers & Services |
| Valero Energy Corporation | 37 | 107 | Energy Producers & Services |
| ING Groep N.V. | 28 | 106 | Banking & Lending |
| Phillips 66 | 38 | 102 | Energy Producers & Services |
| Nordea Bank Abp | 19 | 71 | Banking & Lending |
| Standard Chartered PLC | 31 | 66 | Banking & Lending |
| Fubon Financial Holding Co., Ltd. | 34 | 65 | Insurance & Reinsurance |
| KBC Group N.V. | 22 | 61 | Banking & Lending |
| ArcelorMittal S.A. | 42 | 59 | Metals & Mining |
| Nan Ya Plastics Corporation | 79 | 57 | Chemicals & Commodities |
| Erste Group Bank AG | 32 | 56 | Banking & Lending |
| State Street Corporation | 21 | 54 | Investment & Advisory |
| Commerzbank AG | 30 | 54 | Banking & Lending |
| Cathay Financial Holding Co., Ltd. | 40 | 53 | Insurance & Reinsurance |
| A.P. Møller - Mærsk A/S | 45 | 51 | Transport & Logistics |
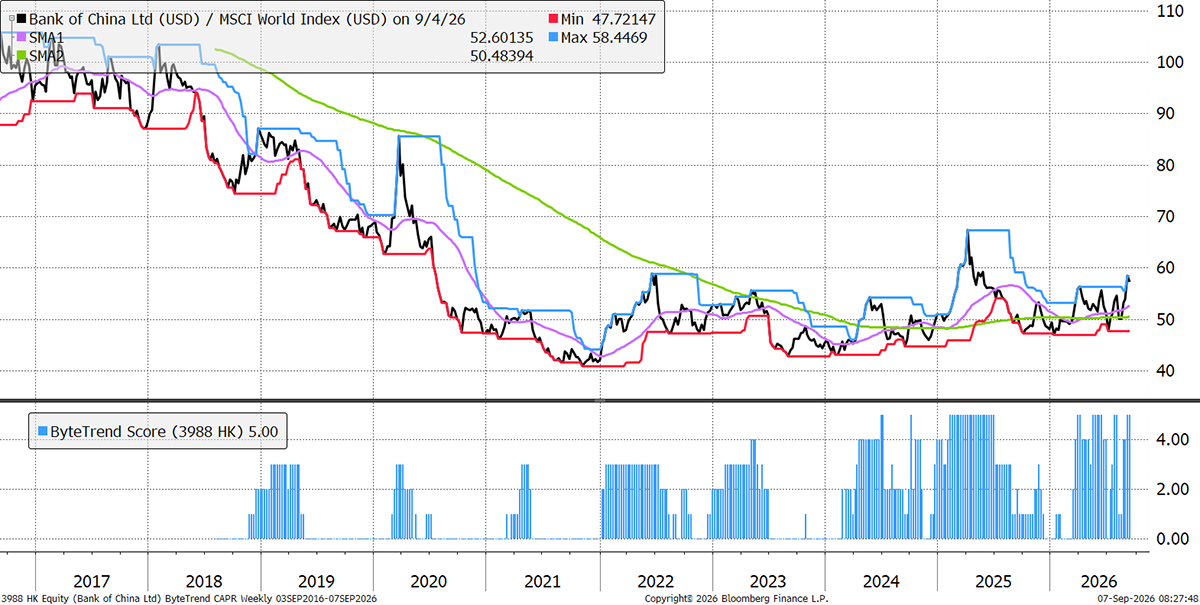
Bank of China
Bank of China is one of China’s “Big Four” state-owned commercial banks and the country’s most internationally oriented major lender. First-half results beat expectations, with profit growth ahead of its peers, and net interest margins creeping higher. In China, deposit rates (which it pays to customers) have been falling, helping reduce costs, maintain strong margins, and increase the dividend.
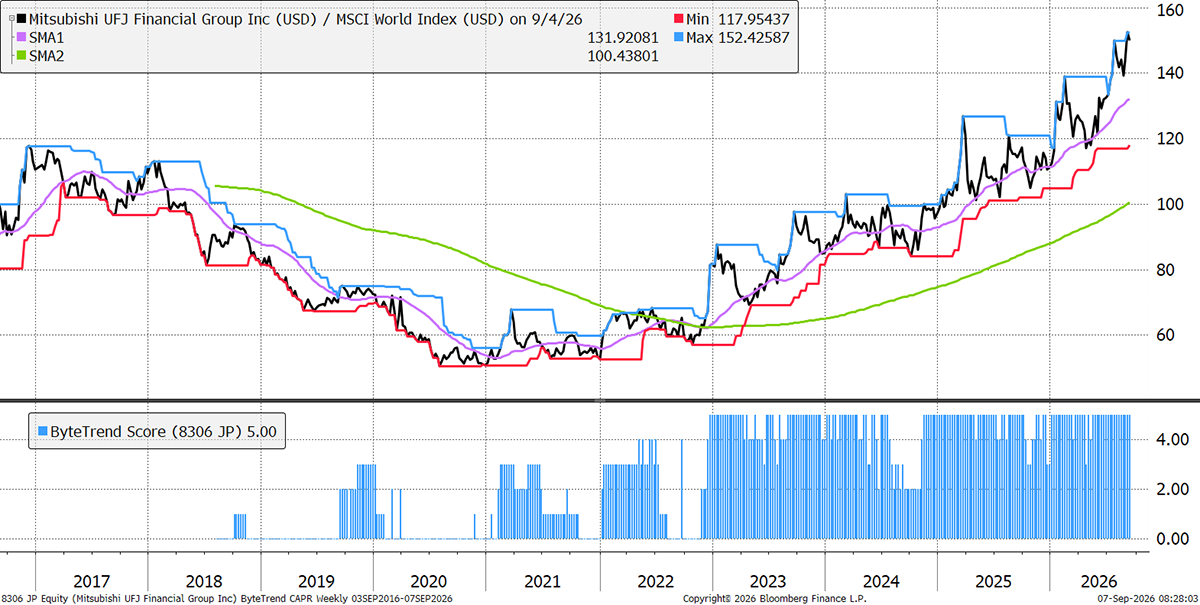
Mitsubishi UFJ
Japan is strong, and so are financials, so it is no surprise to see Japan’s largest financial group, MUFJ, in the Leaders category. Its price/book ratio has gone from 0.4x in 2021 to 2.0x today. Japanese interest rates are slowly normalising (rising from extreme lows), helping the bank, and internal efficiency drives are keeping costs under control. Buybacks and dividends are rewarding shareholders, but currency swings can still affect returns.
New Leading Trends
These stocks are trading at the 30-week CAPR highs with a ByteTrend Score of 5, except they are new trends this week, having previously had a score below 5. All charts shown are CAPR rebased to 100.
| Name | Annual Vol 30w | Mkt Cap $Bn | Industry |
| Bank of China Limited | 23 | 328 | Banking & Lending |
| Robinhood Markets, Inc. | 82 | 110 | Investment & Advisory |
| Deutsche Bank AG | 34 | 78 | Banking & Lending |
| CITIC Limited | 30 | 52 | Diversified Holdings |
| DNB Bank ASA | 14 | 49 | Banking & Lending |
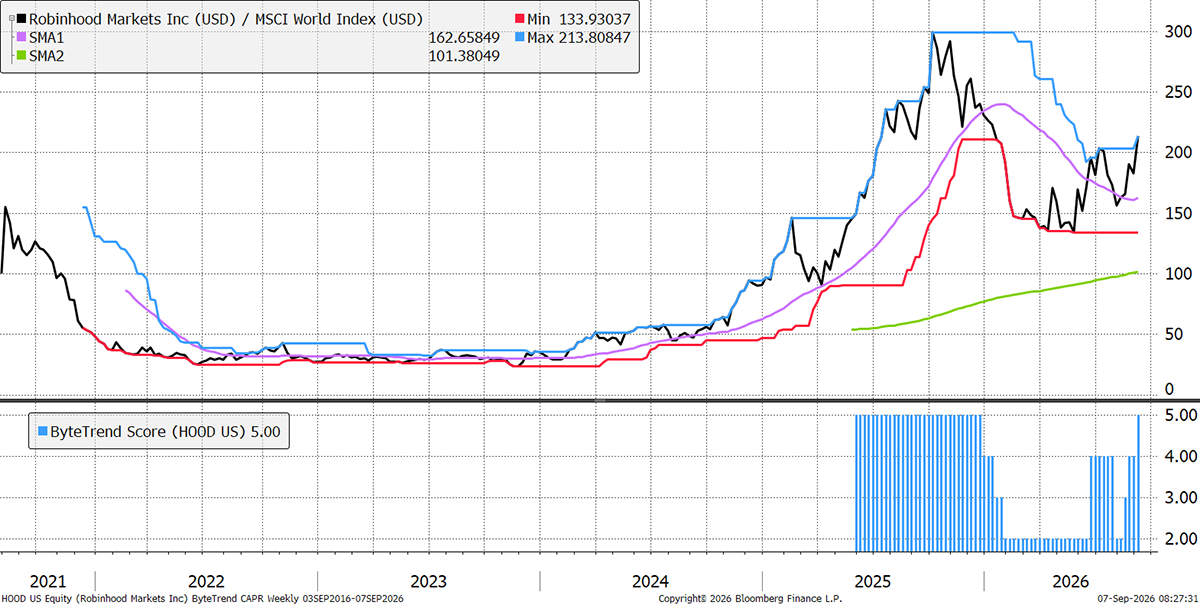
Robinhood
Robinhood offers low-cost trading, with all the gimmicks. The app is gamified, with rewards, graphics, and high levels of stimulation. Costs are low, trading is 24h, and it offers very broad access to different assets. Revenue growth of 32% in its recent results was a record high, and gross margins reached 92%, driven by strong trading volumes and product expansion. New deposits rose 28%, and its subscriber base also hit a record high.
Emerging Trends
These stocks are trading at the 30-week CAPR highs with a ByteTrend Score of less than 5. They don’t have to be in an uptrend, just emerging. All charts shown are CAPR rebased to 100.
| Name | Annual Vol 30w | Mkt Cap $Bn | Industry |
| Salesforce, Inc. | 51 | 212 | Technology Software & Services |
| CSL Limited | 55 | 60 | Healthcare & Life Sciences |
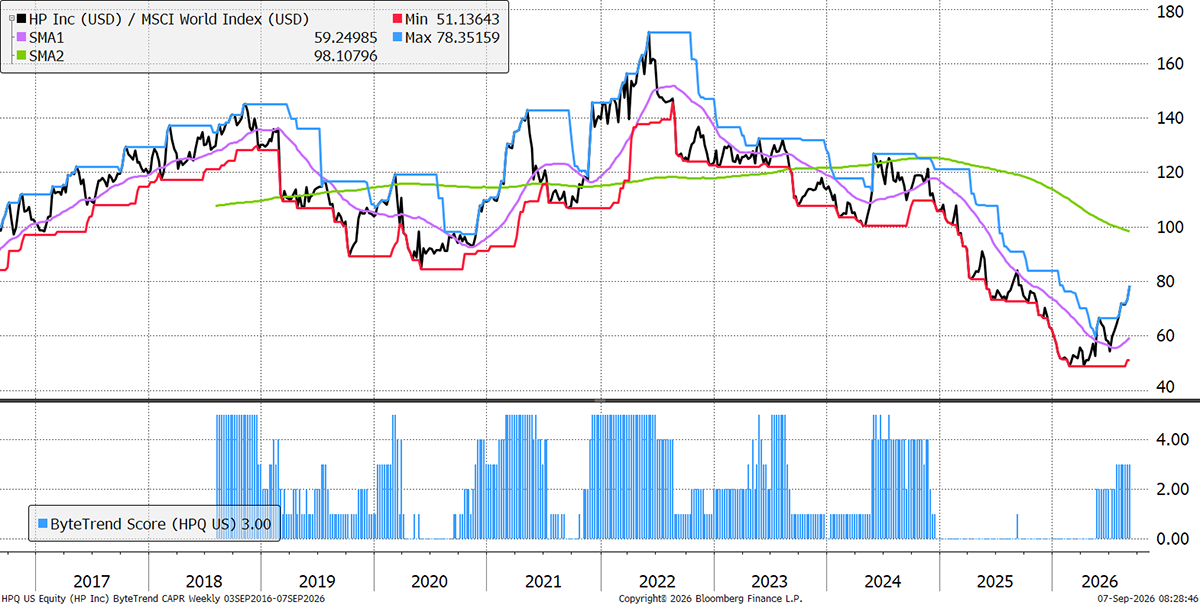
HP
Hewlett Packard shares fell by 50% in 2025, but have staged an impressive comeback. Its most recent results showed record Q3 revenues, marking a 10th consecutive quarter of growth. This was driven by an expanding AI-enabled PC segment, which now makes up half of all sales. Cash generation was strong, and guidance was raised. The tech hardware rally isn’t all over yet.
Weakening
These stocks are trading at the 30-week CAPR lows with a ByteTrend Score above 0. They are weakening trends but not yet downtrends. All charts shown are CAPR rebased to 100.
| Name | Annual Vol 30w | Mkt Cap $Bn | Industry |
| Siemens Energy AG | 42 | 146 | Construction & Engineering |
| Fast Retailing Co., Ltd. | 37 | 136 | General Retail & Consumer Goods |
| Bharti Airtel Limited | 20 | 121 | Telecom & Network Providers |
| British American Tobacco p.l.c. | 35 | 120 | Home & Lifestyle Products |
| Enel S.p.A. | 27 | 105 | Utilities & Clean Energy |
| Trane Technologies plc | 25 | 99 | Construction & Engineering |
| Marriott International, Inc. | 25 | 88 | Leisure & Hospitality |
| Cadence Design Systems, Inc. | 44 | 81 | Technology Software & Services |
| Cummins Inc. | 33 | 77 | Construction & Engineering |
| Engie S.A. | 28 | 71 | Utilities & Clean Energy |
| Hilton Worldwide Holdings Inc. | 20 | 70 | Leisure & Hospitality |
| Shin-Etsu Chemical Co., Ltd. | 39 | 69 | Chemicals & Commodities |
| Mitsubishi Electric Corp. | 37 | 69 | Advanced Industrial Systems |
| TransDigm Group Incorporated | 28 | 65 | Advanced Industrial Systems |
| CRH plc | 34 | 63 | Construction & Engineering |
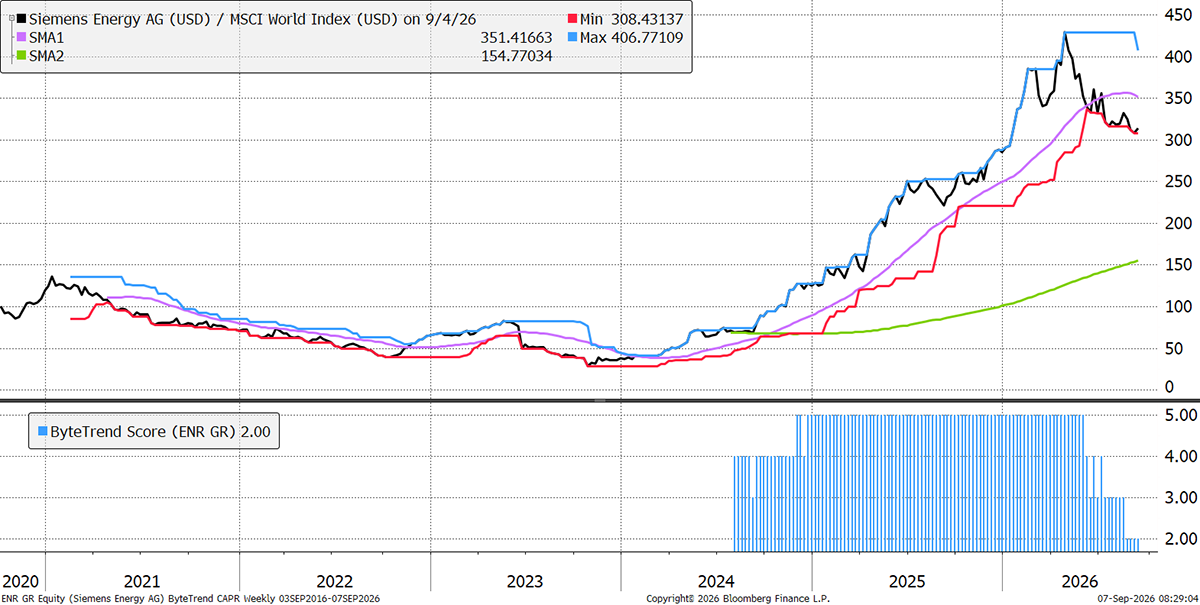
Siemens Energy
From January 2024 to April 2026, Siemens Energy’s share price went from €11 to €191. Revenue growth went from 2% to 15%, while free cash flow margins went from 5% to 19%. This explosion in fundamental and share price performance was driven by record demand for its gas turbines and power grid solutions, as AI and electrification gear up. It even managed to turn around its loss-making wind turbine business, Gamesa. However, the PE ratio rose from 18x to 66x, revenue growth has slowed slightly in recent quarters, and hype around the stock is fading.
Bear Trends
These stocks are trading at the 30-week CAPR lows with a ByteTrend Score of 0. They are in a downtrend. All charts shown are CAPR rebased to 100.
| Name | Annual Vol 30w | Mkt Cap $Bn | Industry |
| Costco Wholesale Corporation | 17 | 406 | Food & Beverage Retail & Distribution |
| Nestlé S.A. | 21 | 249 | Food & Beverage Producers |
| LVMH Moët Hennessy - Louis Vuitton, Société Européenne | 29 | 246 | Home & Lifestyle Products |
| McDonald's Corporation | 17 | 182 | Food & Beverage Producers |
| Hermès International S.C.A. | 31 | 177 | Home & Lifestyle Products |
| The TJX Companies, Inc. | 24 | 146 | General Retail & Consumer Goods |
| Prologis, Inc. | 20 | 128 | Property & REITs |
| HDFC Bank Limited | 22 | 116 | Banking & Lending |
| Lowe's Companies, Inc. | 26 | 115 | Home & Lifestyle Products |
| Enbridge Inc. | 23 | 109 | Energy Producers & Services |
| The Southern Company | 19 | 101 | Utilities & Clean Energy |
| Duke Energy Corporation | 19 | 94 | Utilities & Clean Energy |
| Christian Dior SE | 27 | 83 | Home & Lifestyle Products |
| EssilorLuxottica S.A. | 32 | 80 | Healthcare & Life Sciences |
| National Grid plc | 28 | 78 | Utilities & Clean Energy |
| Vinci S.A. | 23 | 74 | Construction & Engineering |
| Northrop Grumman Corporation | 32 | 73 | Advanced Industrial Systems |
| O'Reilly Automotive, Inc. | 22 | 73 | General Retail & Consumer Goods |
| Colgate-Palmolive Company | 18 | 71 | Home & Lifestyle Products |
| América Móvil, S.A.B. de C.V. | 31 | 69 | Telecom & Network Providers |
| Aon plc | 27 | 69 | Insurance & Reinsurance |
| Honeywell International Inc. | 30 | 66 | Diversified Holdings |
| Realty Income Corporation | 18 | 57 | Property & REITs |
| NIKE, Inc. | 36 | 57 | General Retail & Consumer Goods |
| Public Storage | 25 | 56 | Property & REITs |
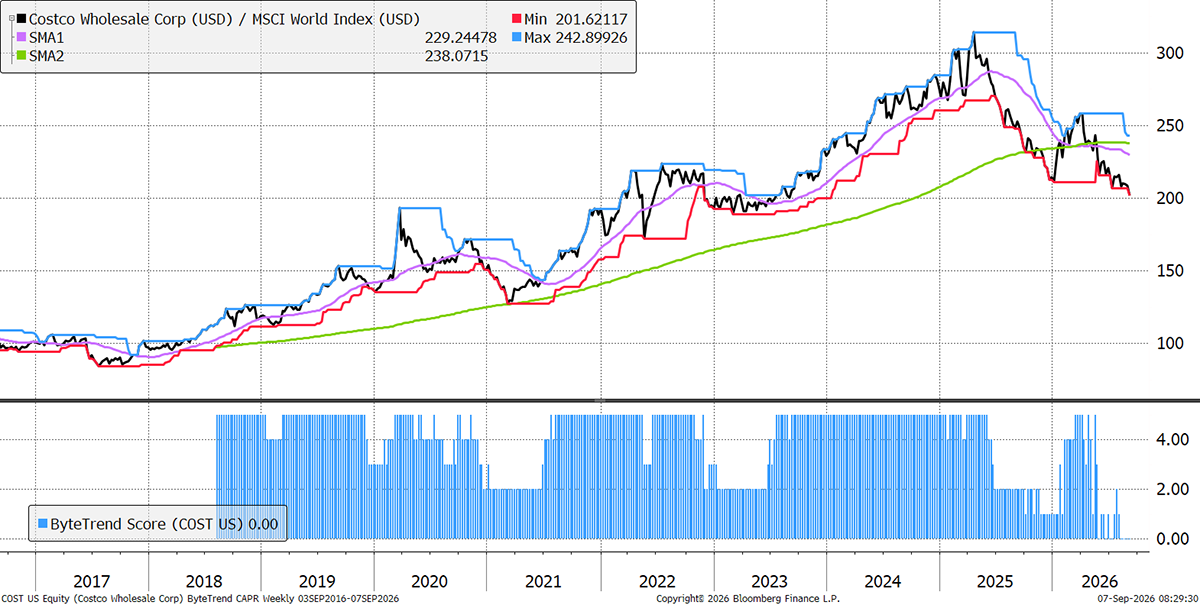
Costco
Costco’s membership scheme and low costs have helped it compound at high rates for many decades. However, investors have known and loved this stock for just as long, and its valuation became more expensive year after year. After peaking at a PE of 63x in February 2025, versus a long-term average of 25x, it has been giving ground back. Starting valuations matter, regardless of company quality.
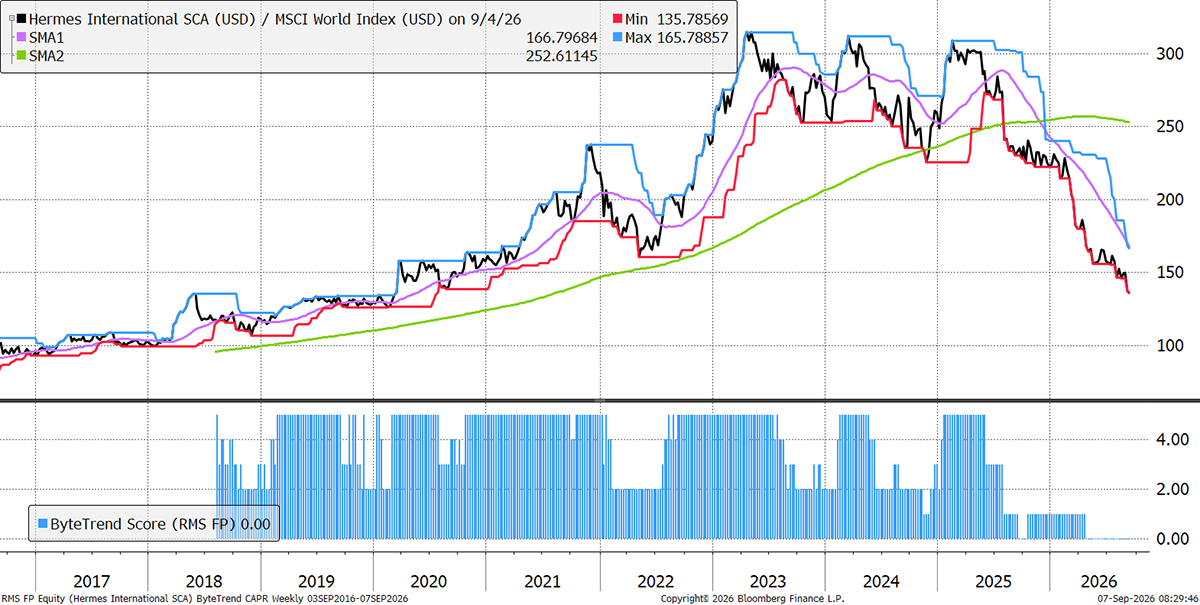
Hermes
Hermes is seen as a very high-quality company because of its history, brand strength, and craftsmanship. This led to extreme valuations and, like Costco, the price got too high. They had pushed their product prices too high too fast. This helped revenue growth reach 40% in 2022, but a multi-year period of weakness in China and cost-of-living issues elsewhere have led to four years of slowing revenue growth, now just 3%. A high valuation and slowing growth don’t go well together.
GTI 200 Spreadsheet
We are pleased to share the GTI 200 spreadsheet. Download the spreadsheet below to view the CAPR and local currency scores, and more, for the world’s largest 200 stocks. Have a look at the different groups and the main list “All stocks”. The Insights tab is interesting, and don’t forget to expand the columns by clicking on the “+” at the top of the page if you want to see more trend data.
Outlook
In a slow week, the bull market resumes but with less chutzpah than usual. Beware the autumn. Too many of the market's biggest shocks came in October.
Thanks for reading GTI.


