


Time to be Calm


Issue 91;
- The market rotation enters a new phase as defensives settle into a leadership role.
- Focus on calm stocks; avoid volatility.
- Materials are under pressure, along with technology.
The World Index holds a ByteTrend Score of 2 in USD. Price has improved since last week but remains below the 30-day moving average, which is downward sloping.
iShares MSCI World ETF (URTH) Developed Markets – Daily, 6 Months
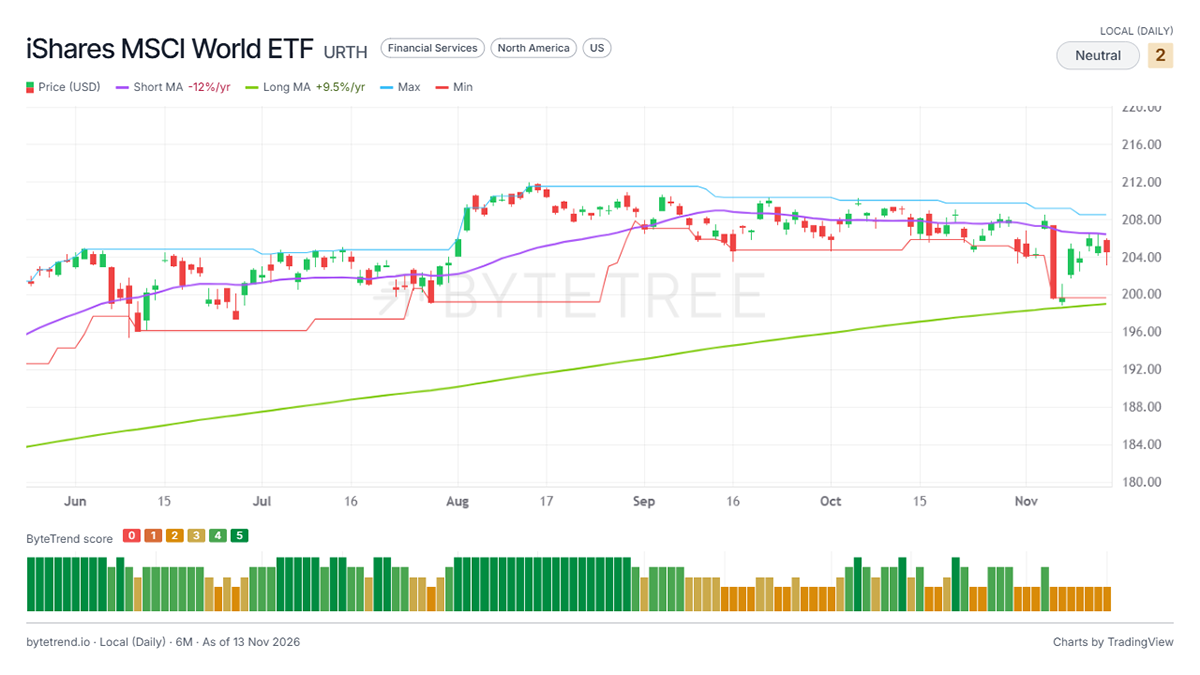
It was a fairly neutral week. The World Index was broadly flat. The rotation continued, but gently. AI stocks lost, most notably Nvidia for stock-specific reasons, while the Magnificent 7 and other large-cap quality stocks rose.
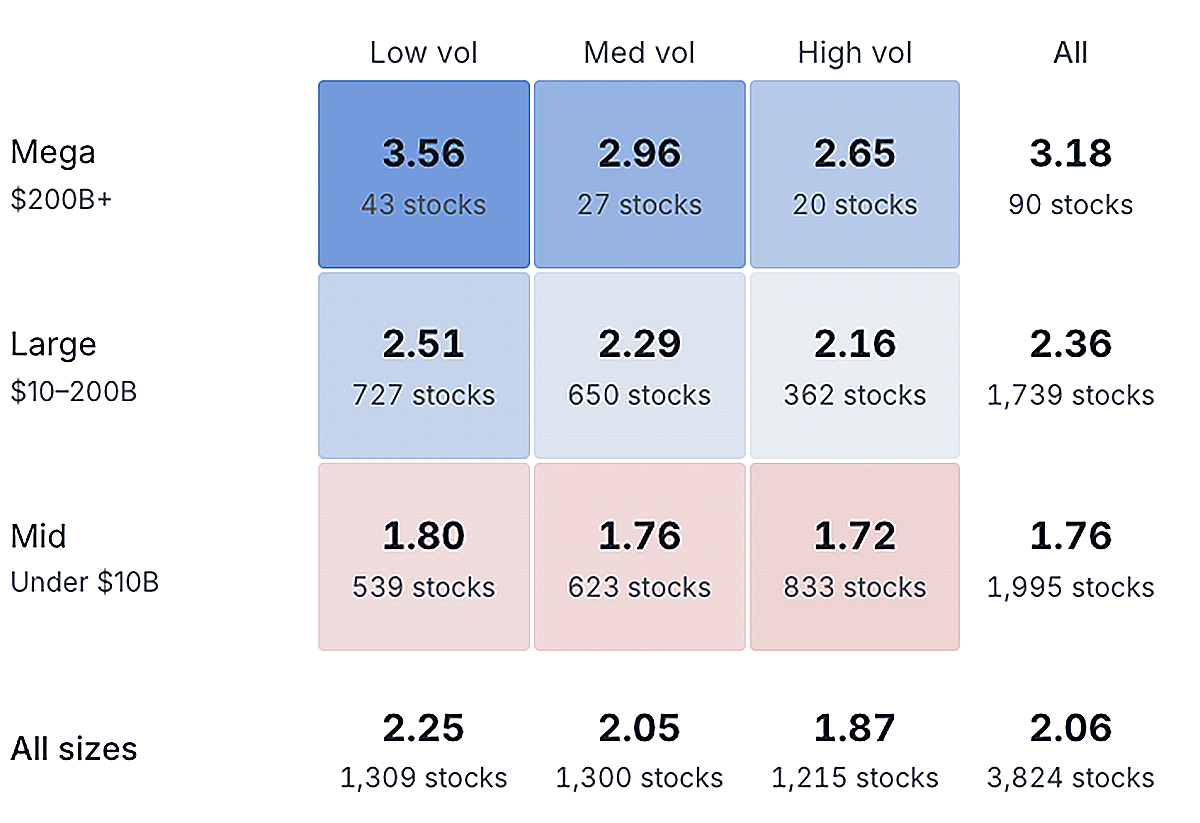
One easy way to see this is through size and volatility. Three months ago, high-volatility stocks were by far the strongest. Today, the picture is different. Currently, you need to own stable, safe, low-volatility stocks to outperform the market.
Average Weekly CAPR Score by Size and Volatility Basket
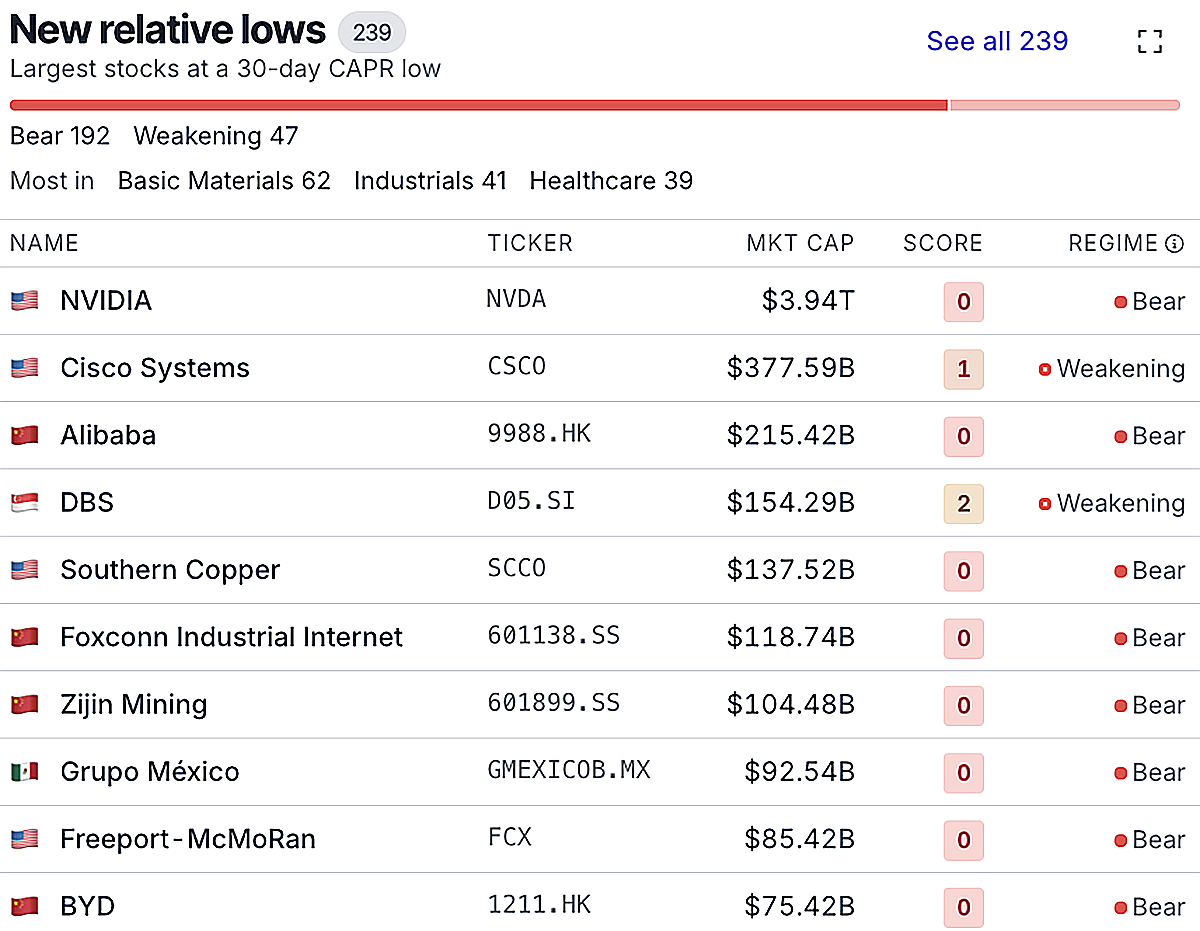
This is visible in today’s relative highs and lows. In the list of new lows, copper is notably weak (Freeport, Zijin, Southern), along with tech stocks like Cisco and Foxconn. These were the same trade to an extent, given how much copper is needed to build the physical infrastructure for AI.
CAPR: New Relative Lows
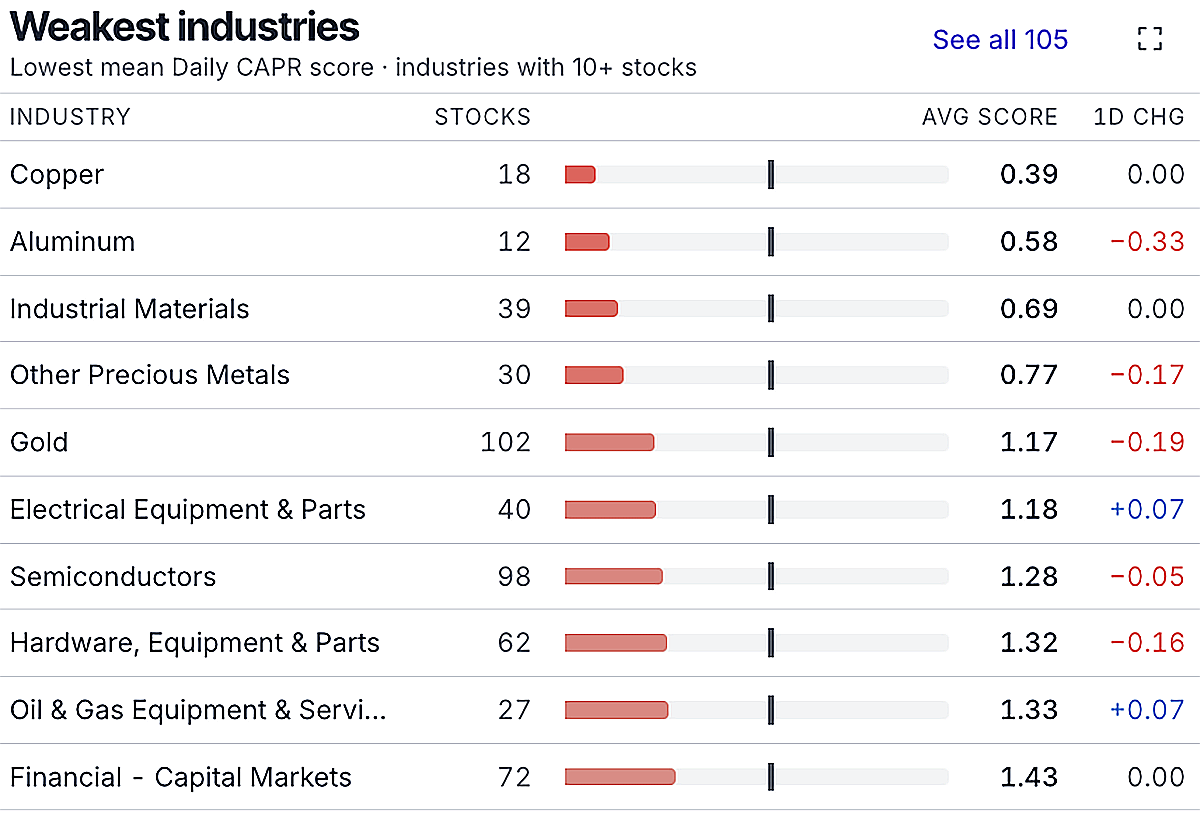
Copper is the weakest industry by average daily CAPR Score. There are very few copper stocks not scoring 0, which could be a warning sign, as copper sometimes reflects global economic strength.
Weakest Industries by Average CAPR Score
As for new highs, large-cap and low-volatility US stocks show up most clearly. Apple is the relatively safe option among the Magnificent 7, having committed the least to AI spending. Eli Lilly, Johnson & Johnson, and McKesson are healthcare giants, while Coca-Cola and Costco are household names.
CAPR: New Relative Highs
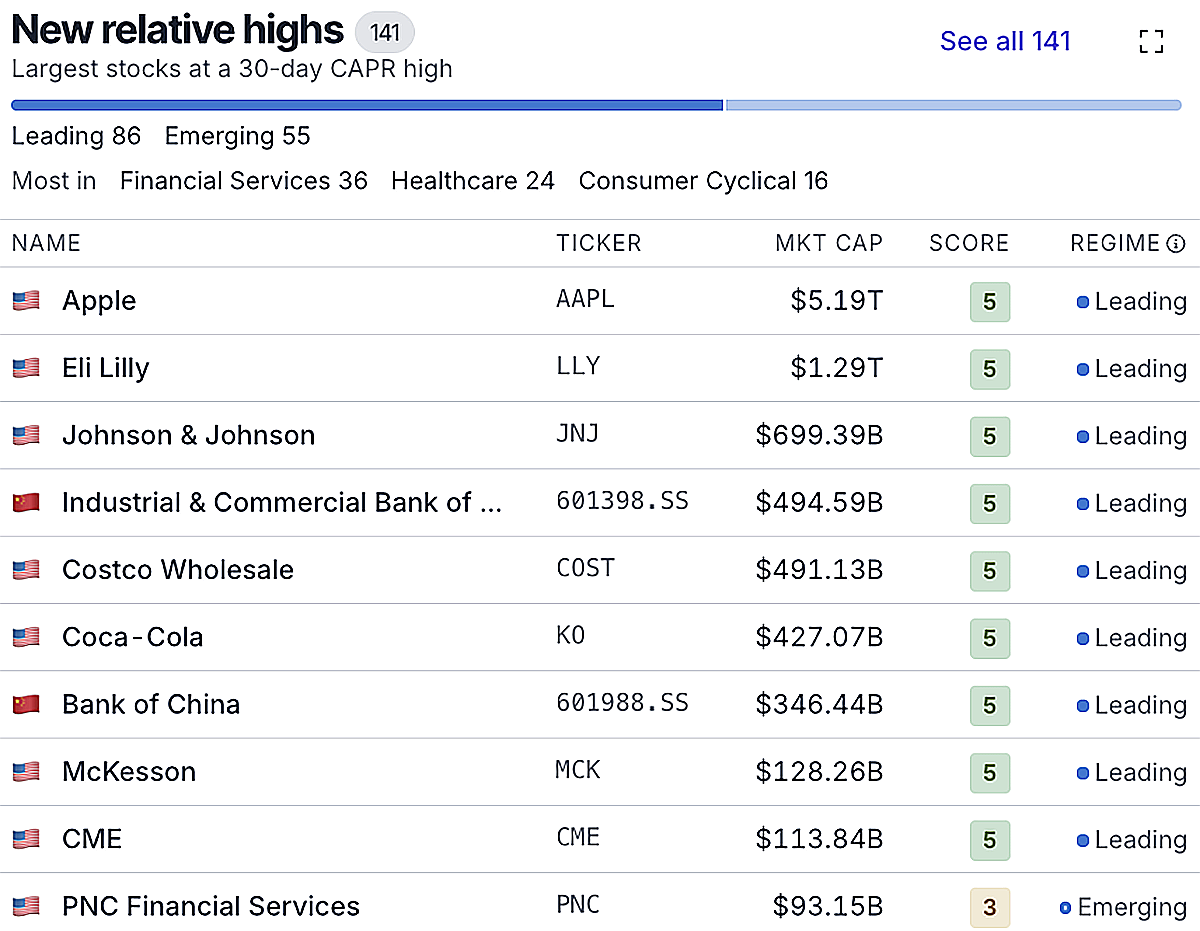
Defensive names from Healthcare and Consumer Staples now dominate the market leadership.
Which Sectors Are Emerging?
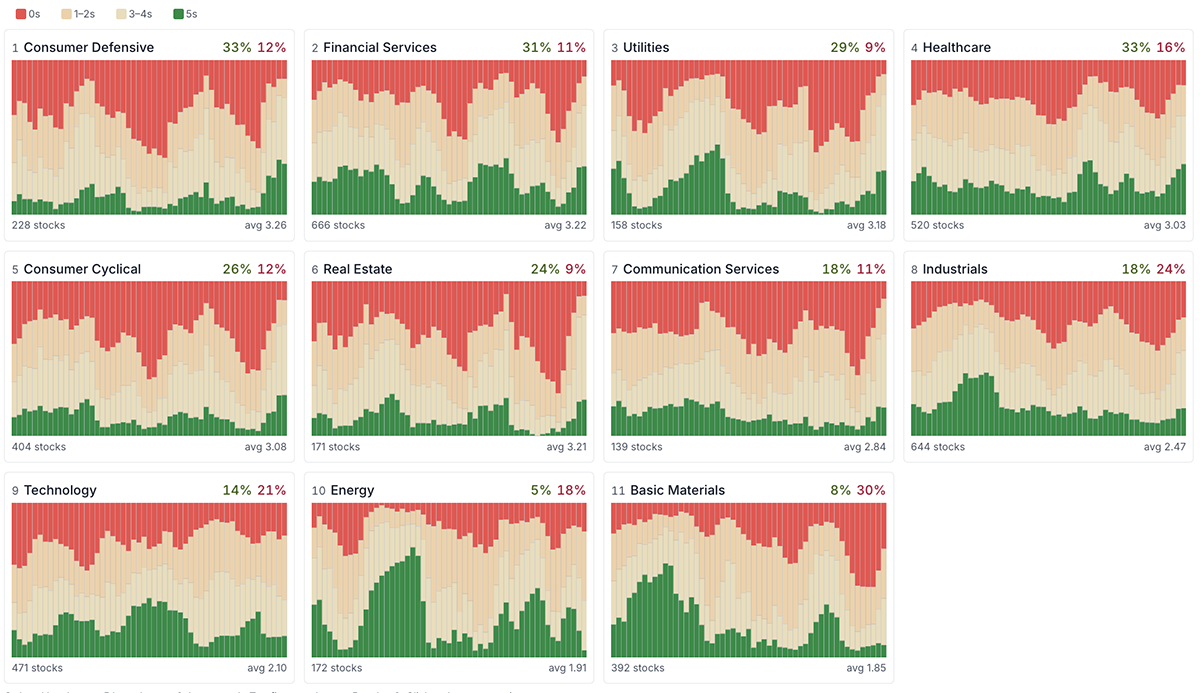
These charts show the number of 5s, neutral trends, and 0s over time (right = most recent).
The number of daily (short-term) CAPR trend scores of 0 (the red bars) is retreating sharply in all sectors except Technology and Materials. The most notable recoveries are in Real Estate and Consumer. The 0s have become neutral, and a few stocks are starting to become 5s.
If you are looking to own the winners, pay attention to the green bars. For example, 33% of Consumer Defensive stocks currently have a daily CAPR trend score of 5, while only 8% of Basic Materials stocks do. The sectors are ranked from strongest to weakest.
Daily Alpha Breadth by Sector
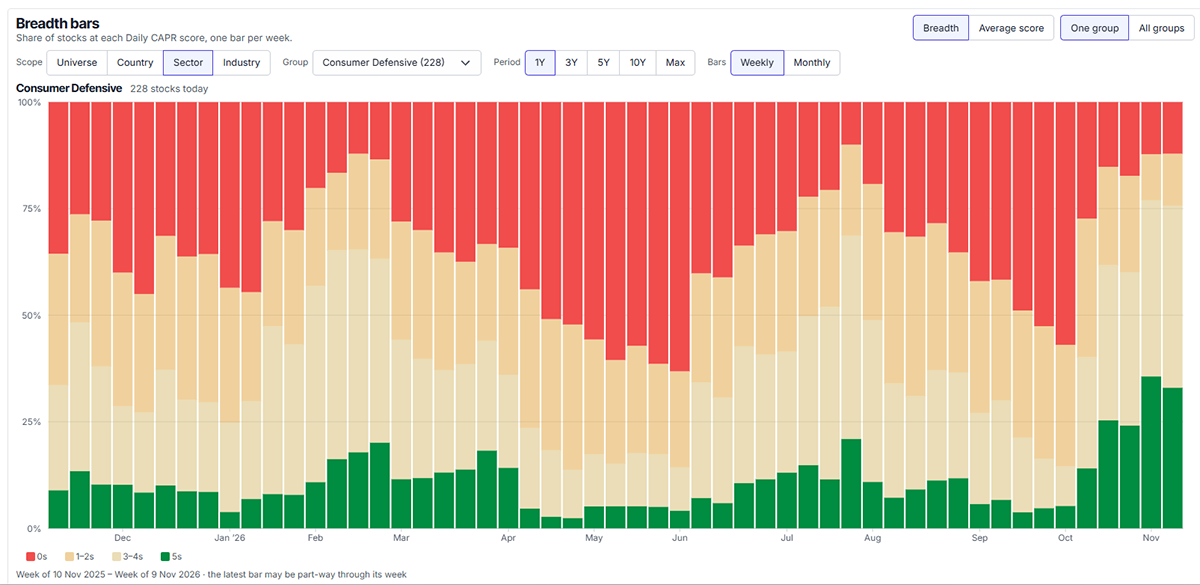
Consumer Defensives have seen a strong recovery. Toothpaste and washing-up liquid get bought when they run out, no matter what’s happening in the tech sector. They also can’t be disrupted by AI.
Daily CAPR Sector Average Trend Scores
A Global Map of Alpha
At the country level, Denmark is the strongest. No Danish stocks have a daily CAPR score of 0.
Denmark: 1-Year Daily Alpha Breadth
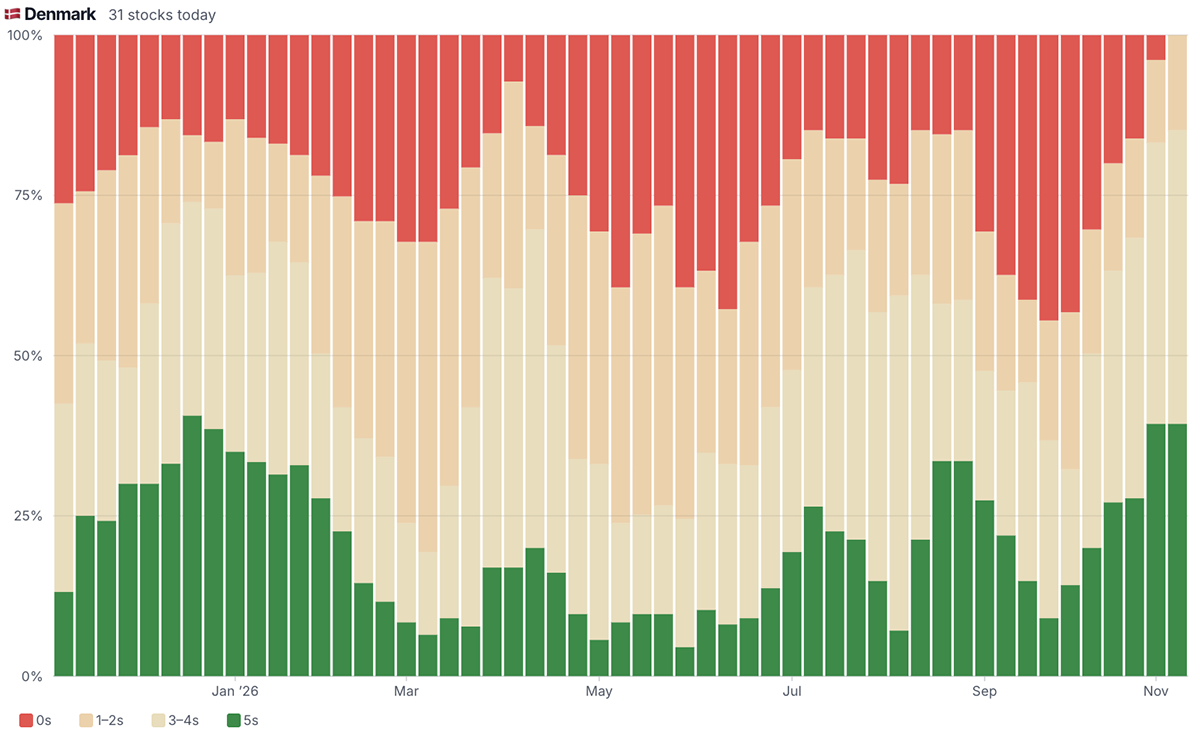
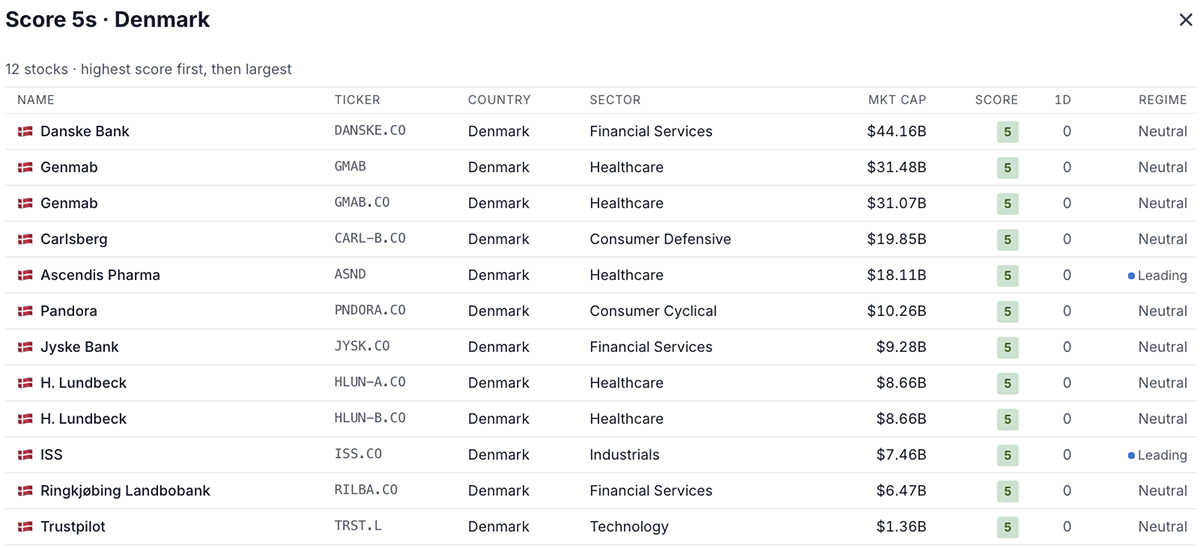
This group is dominated by healthcare stocks. The list below shows the Danish stocks currently scoring 5 (including both the A and B share classes).
Denmark: Daily CAPR 5s
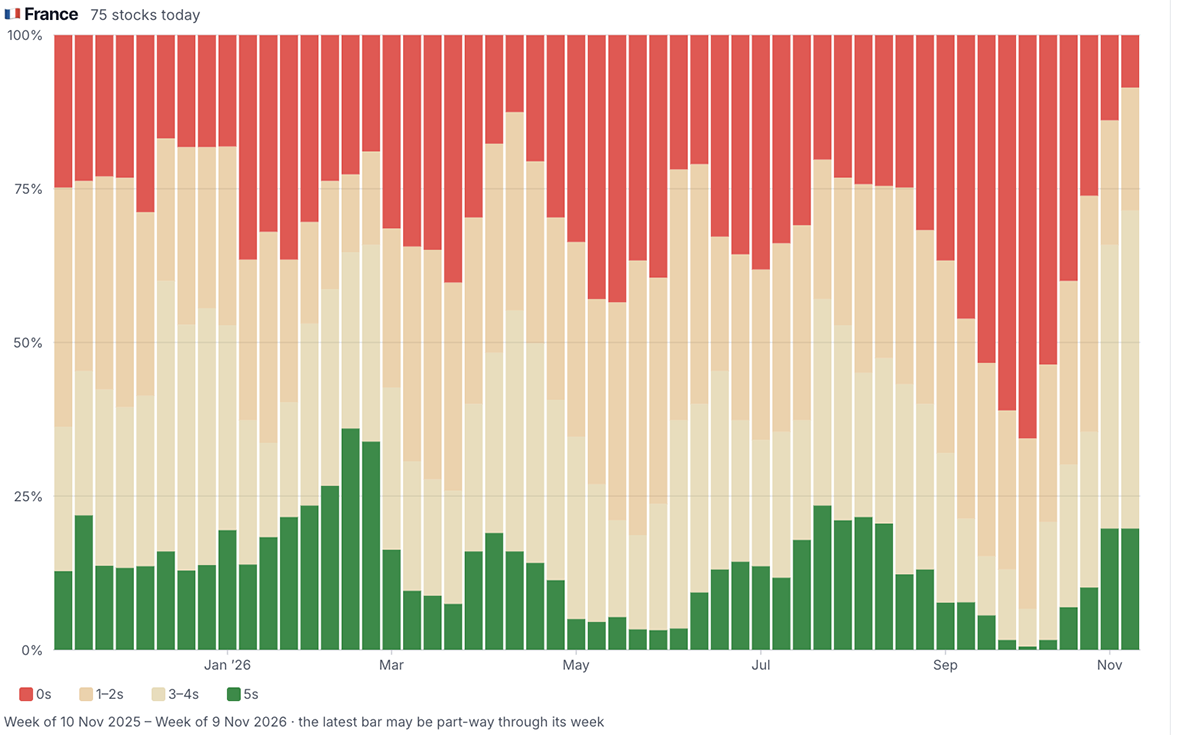
France’s bear trends have retreated sharply since the panic over their bonds in October.
France: 1-Year Daily Alpha Breadth
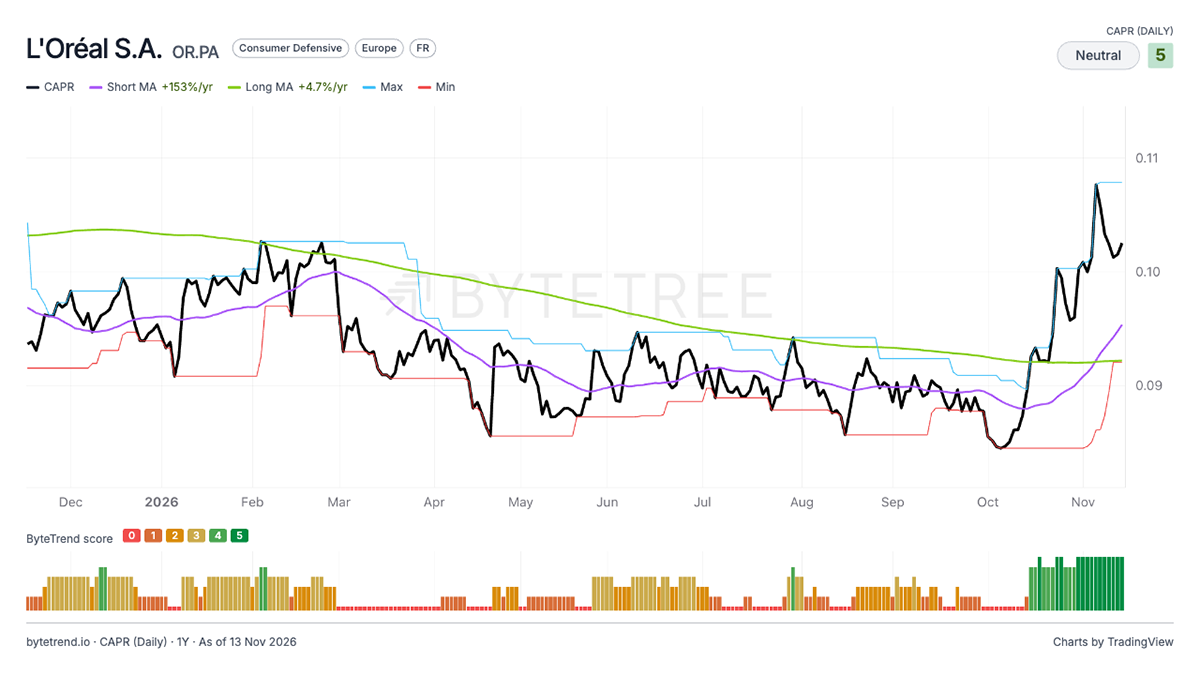
France’s largest stock is L’Oréal. It has endured a multi-year decline, relative to the index, but has surged in the recent rotation. It is a defensive, quality stock and a French company, giving it both a sector and a country tailwind in recent weeks.
L’Oreal: Daily CAPR, 1 Year
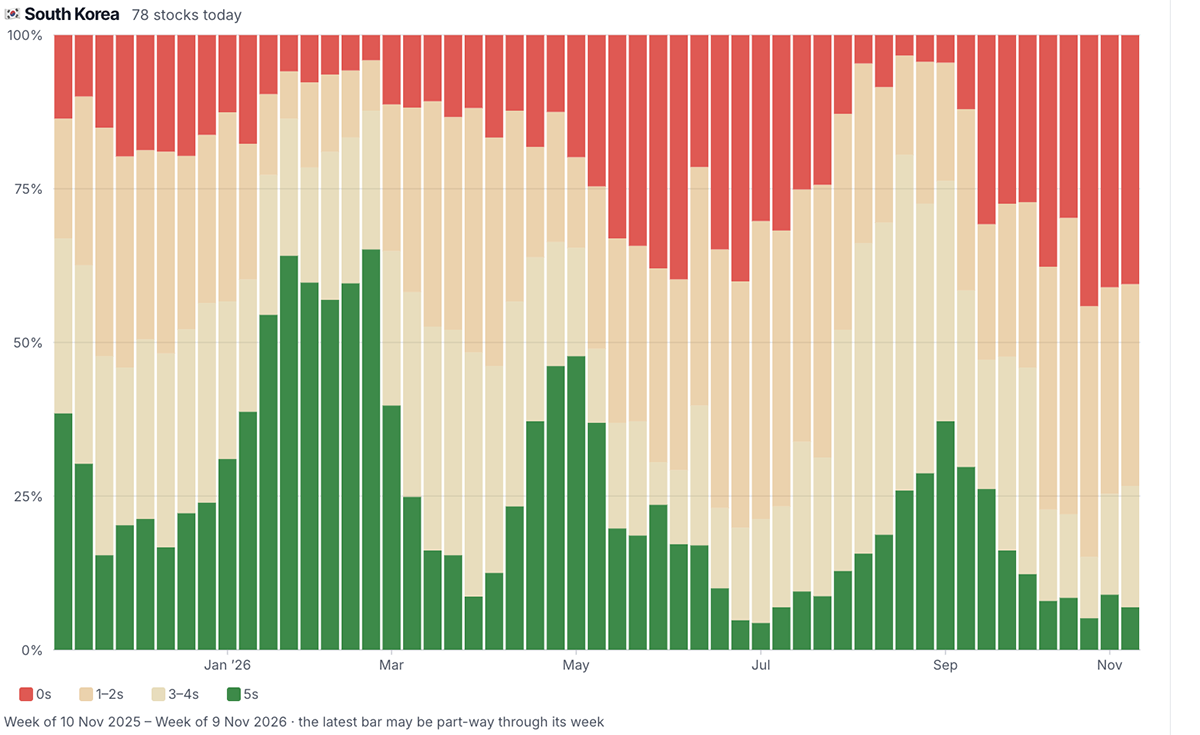
South Korea, on the other hand, has seen strong trends disappear, as the AI bull market fades. Korea is an interesting example on the ByteTrend platform because the breadth chart shows a richer picture than the index price and performance. The KOSPI is dominated by Samsung and SK Hynix, which together account for 50% of its market capitalisation. As a result, the index price mainly reflects their price. Breadth reflects strength or weakness in broad, equal-weight terms.
South Korea: 1-Year Daily Alpha Breadth
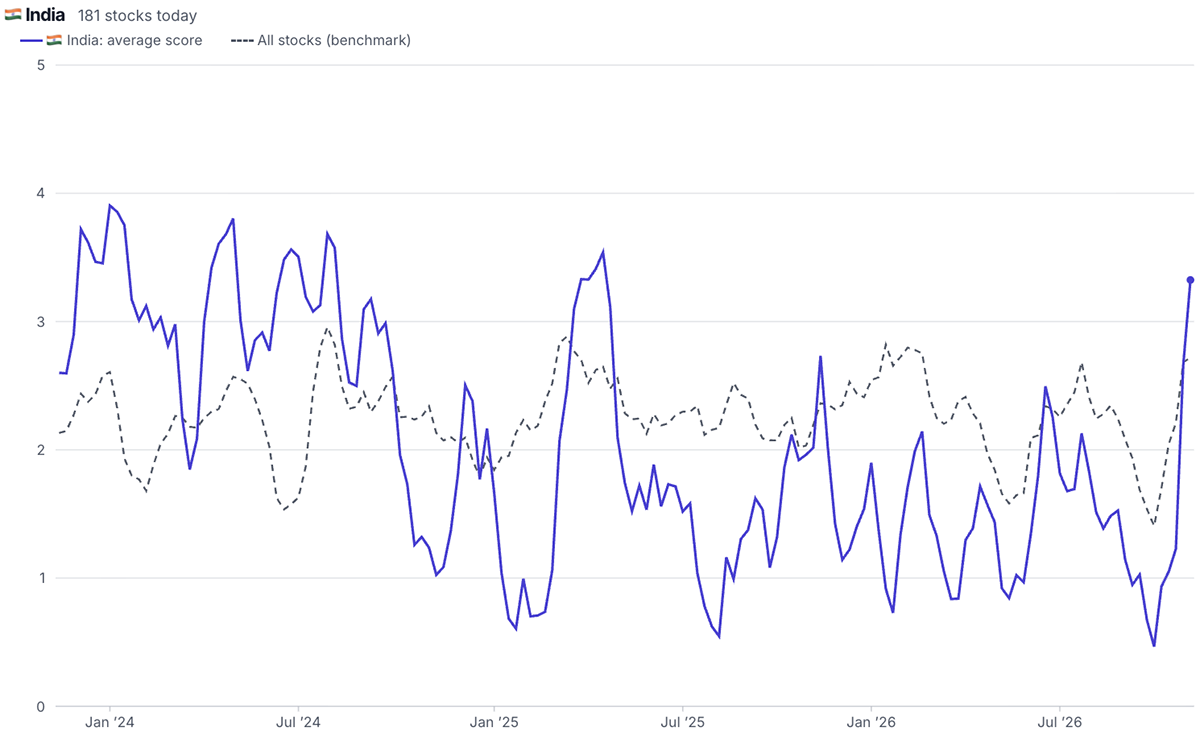
Next is India, which had another strong week. Its average daily CAPR score is back above the universe for the first time since April 2025.
India: Average CAPR Score vs the Universe Average
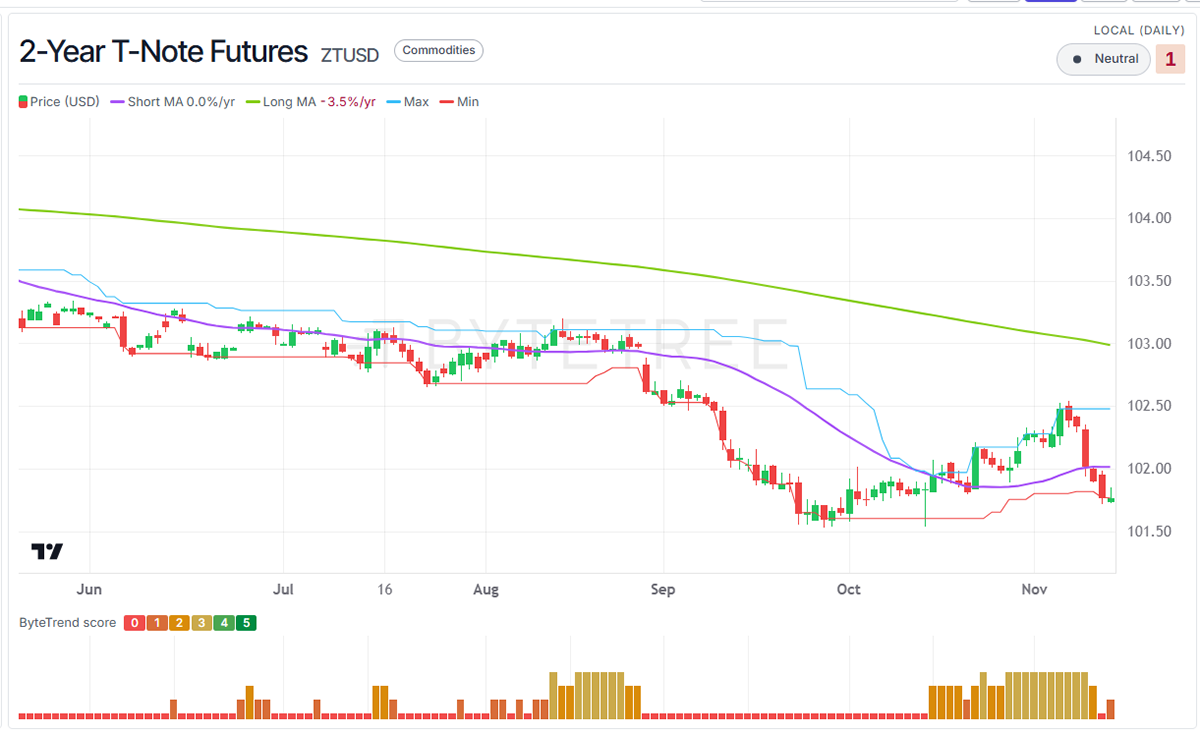
Last week, we pointed out that bonds were rising relative to equities. That has now reversed, as bond yields rose sharply (as prices fell, shown below). Rates are expected to move higher.
US 2-Year Treasury Futures
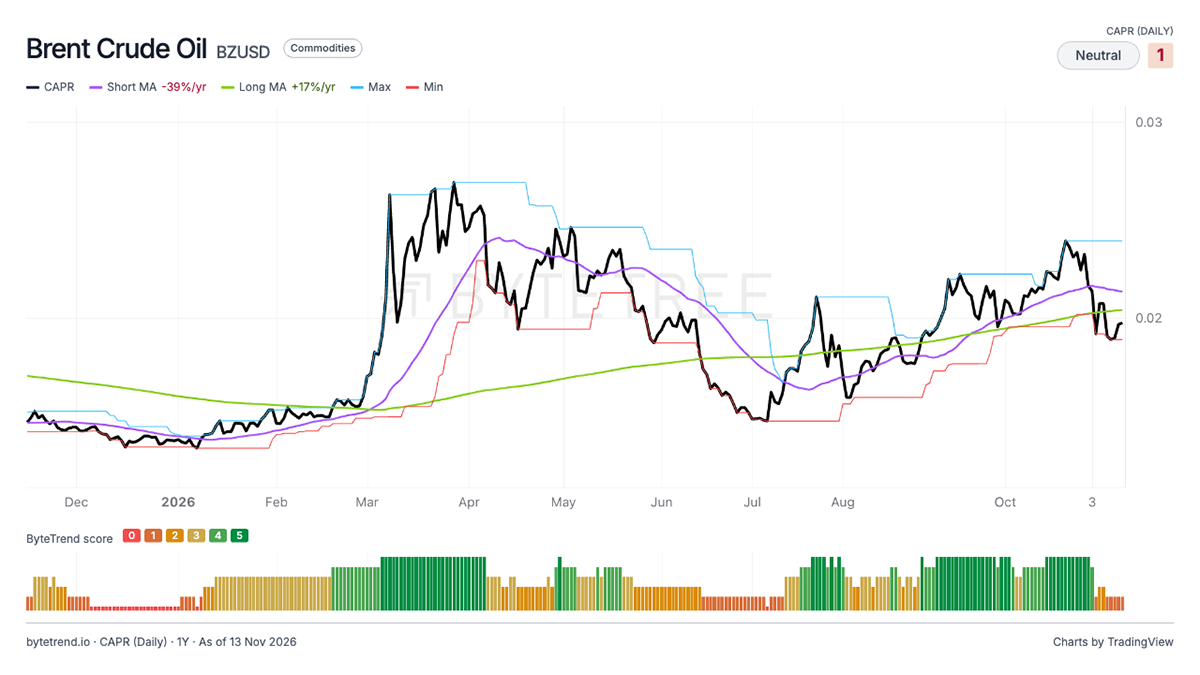
To finish, we look at oil and gold. Oil took a big hit following the midterms, as Trump appeared to walk back on previous statements regarding renewed attacks against Iran. However, the 200-day moving average is still rising, the oil price has remained above it, and the problems have not gone away.
Brent Crude: 1-Year Daily Price Trend
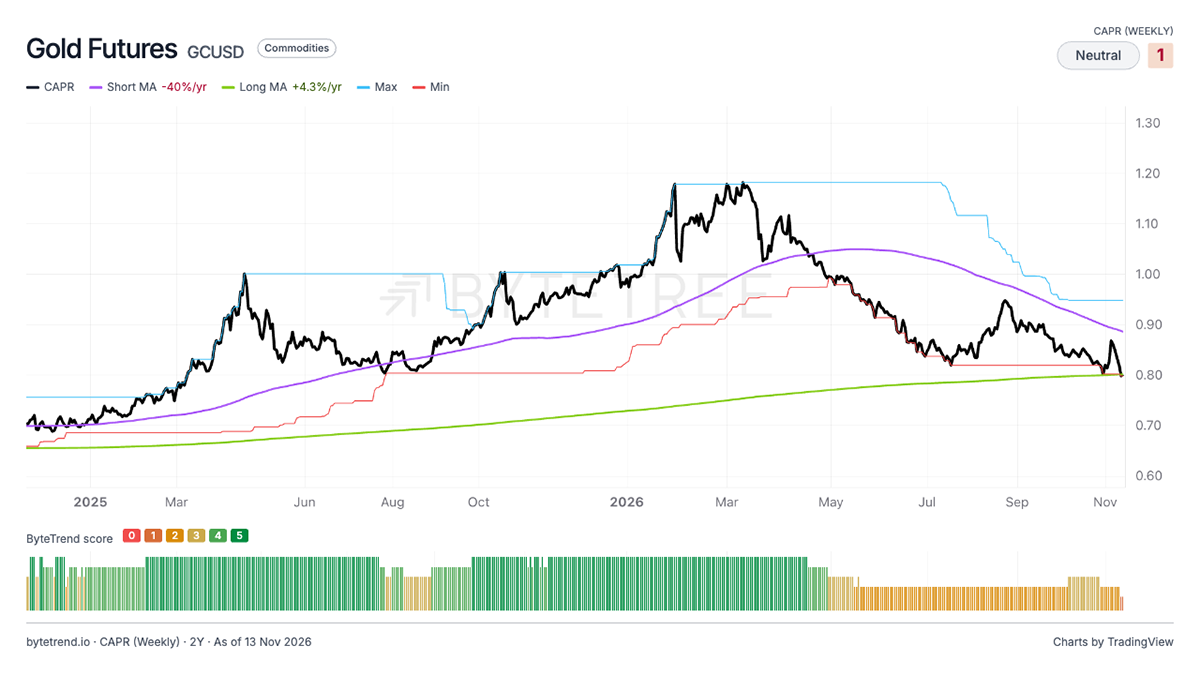
As for gold, the trend has weakened in the short term but, in the long term, it has only just reached its long-term moving average, which is still rising. These are important times for the gold trend.
Gold Futures
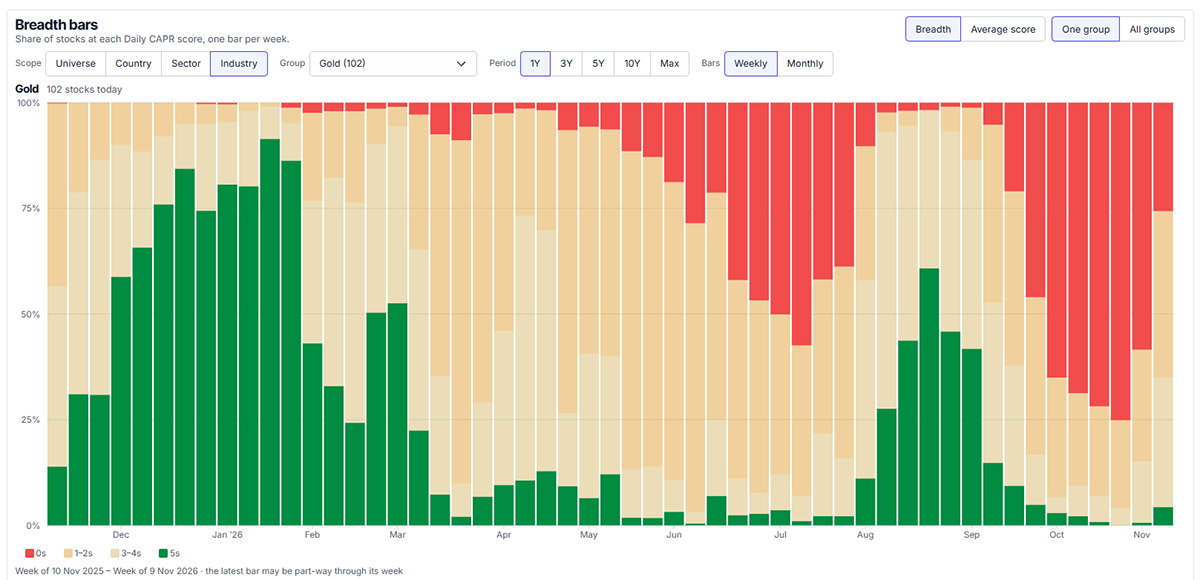
The gold equities smell the low. Things might be getting better.
Gold Stocks: Breadth
We are adding greater refinement to ByteTrend.io’s screening capabilities, but we can already rank the outliers. These stocks trade in a daily uptrend and have ByteTrend scores of 5.
Gold Stocks: Breadth

This week, we added a new feature to the Securities page that shows the gradient of the 200-week and 30-week moving averages. In the ETFs section, by filtering for only CAPR 5s and then sorting them by long-term trend strength (i.e. a steeper upslope on the gradient), we can identify the fastest-moving strong trends. Filtering among ETFs rather than single stocks also shows us themes.
ETFs: 5s Ranked by Moving Average Gradient
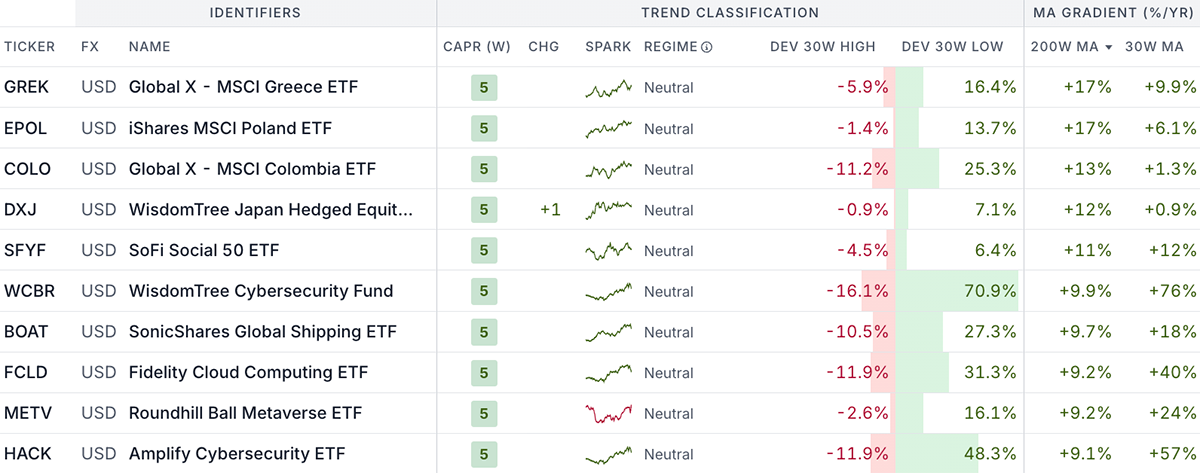
The results are interesting, showing Greece, Poland, and Colombia as the three strongest trends. Cybersecurity is strong as AI drives a rapid proliferation of digital threats, and Shipping remains strong as peace is yet to truly arrive in the Strait of Hormuz.
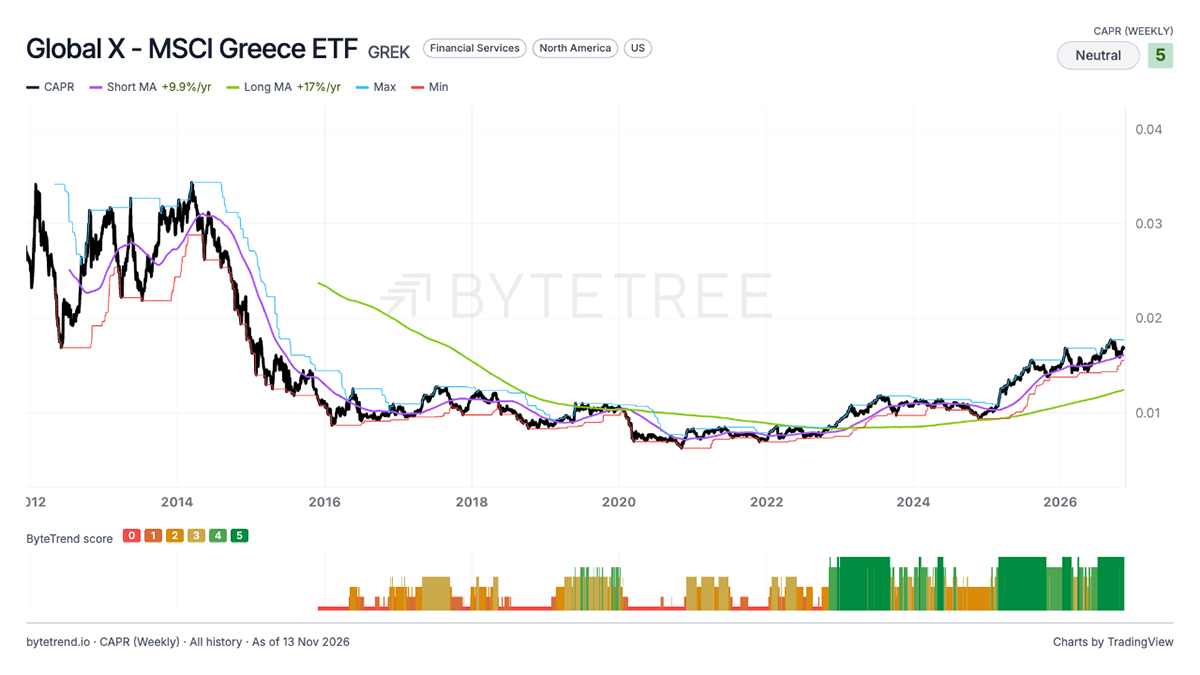
Greece’s 15-year history is particularly interesting. The collapse following 2008 and the various debt crises were severe, but since then, reform and revival have made it a quiet star of the global stockmarket.
Greece: Weekly CAPR, 15 Years
Outlook
The market is undergoing a major transition. The tech sector is the problem, but it may hold up for months, possibly years. In the meantime, ByteTrend captures the rotation, enabling investors to reposition accordingly.
ByteTrend was made to help investors manage risk and improve returns.
It flags the weakest trends and finds the strongest trends, all on a single market intelligence platform.
For access to the live data platform, covering equities, commodities, futures, ETFs, Crypto, and more…
Sign up to ByteTrend now:
You’ll be able to:
- See the comprehensive map of global alpha.
- Dive deeper into the trend strength of sectors, countries, and industries you follow.
- Filter for strong trends in seconds.
- Identify individual securities to consider, based on their trend.
Thank you for reading our weekly Global Trends: Macro update. Follow us on X for additional updates and YouTube for video summaries of the data and trends. Please feel free to forward this note to anyone who may find it of interest.
All the best,
Charlie Morris and Kit Winder
Editors, Global Trends


