
Hot War Resumes


Issue 63;
- Stick with energy as the Strait of Hormuz remains closed.
- A narrow bull market dominated by the chip frenzy.
- Avoid the luxury goods sector as they lead the bear.
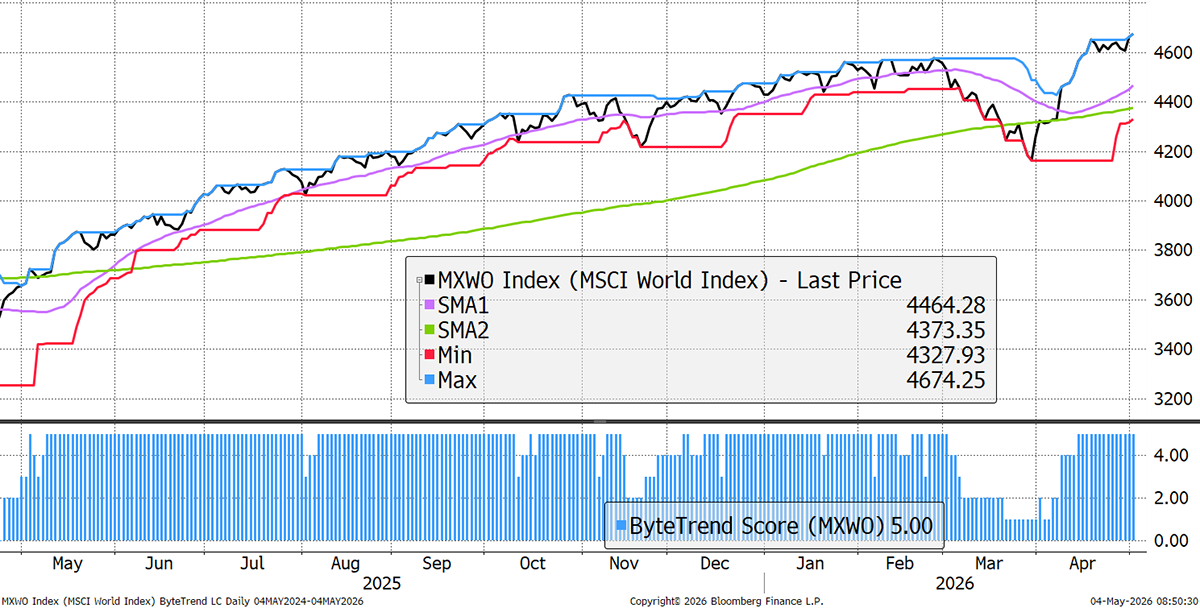
The World Index maintains a bullish ByteTrend Score of 5 in USD. Since the April surge, it has slowed, but it is still a bull market.
World Index – Developed Markets – Daily
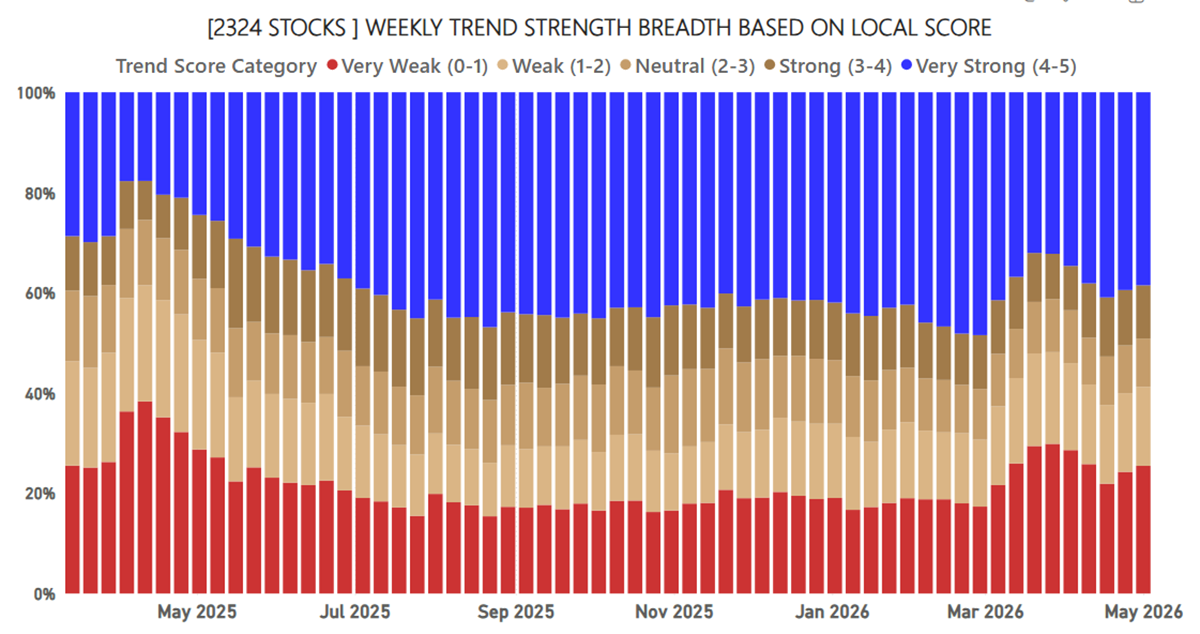
Global Equity Breadth – Local Currency
Under the surface, the number of stocks rising (blue) versus falling (red) has retreated for two consecutive weeks. That means fewer stocks are driving this bull market
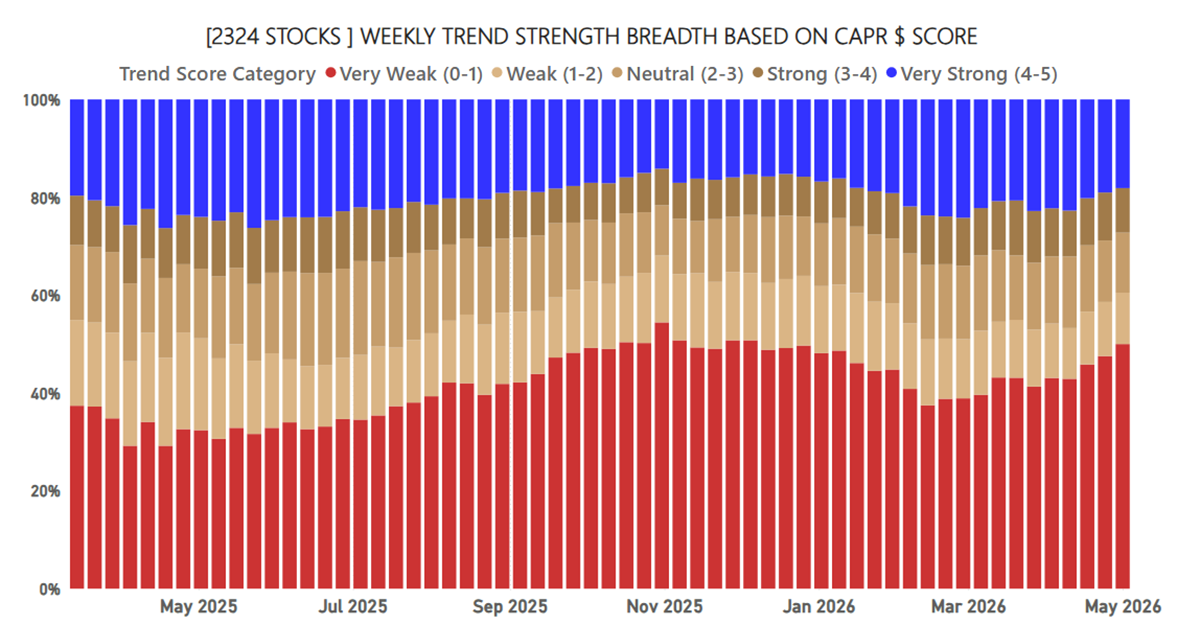
Global Equity Breadth – CAPR - Relative to the World Index
Looking at the same chart in relative terms shows how the leadership is narrowing. Notably, 50% of global stocks are underperforming the market (red), while just 18.1% (blue) are leading. This is what a bubble looks like.
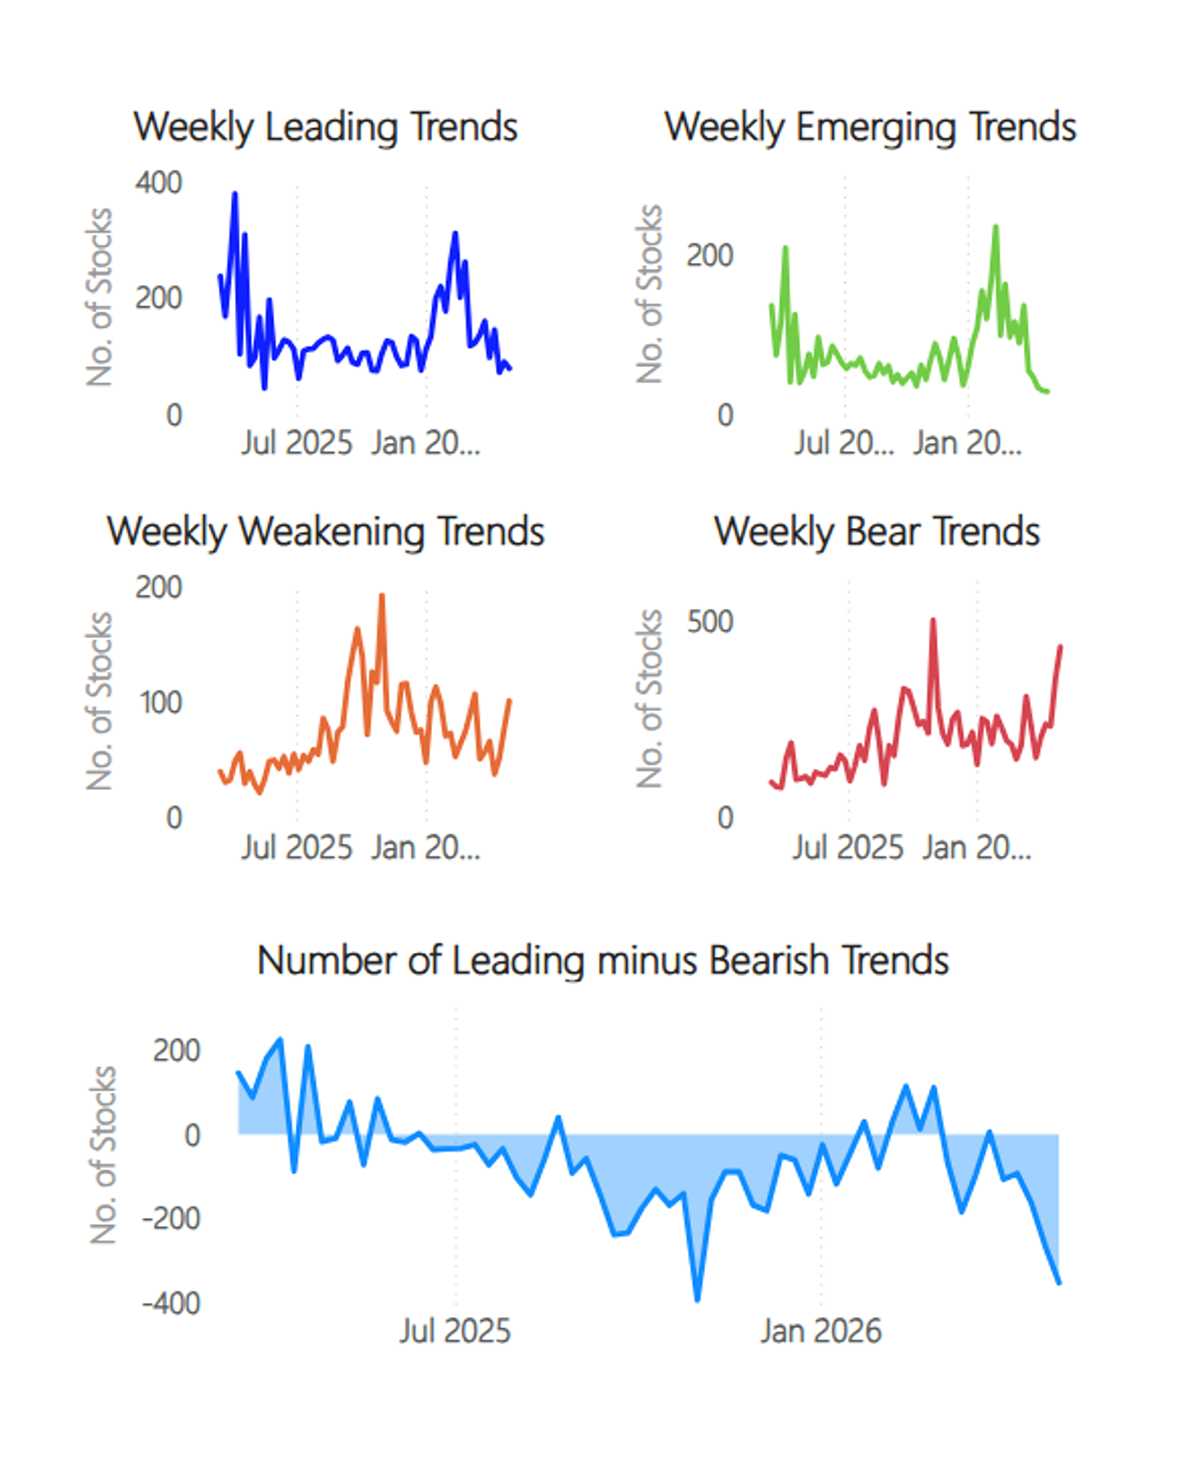
Explosion in Bear Trends
The number of new price highs has slackened. Some stocks keep rising, but they are few in number. The number of bear trends has exploded higher, with weakening trends not far behind.
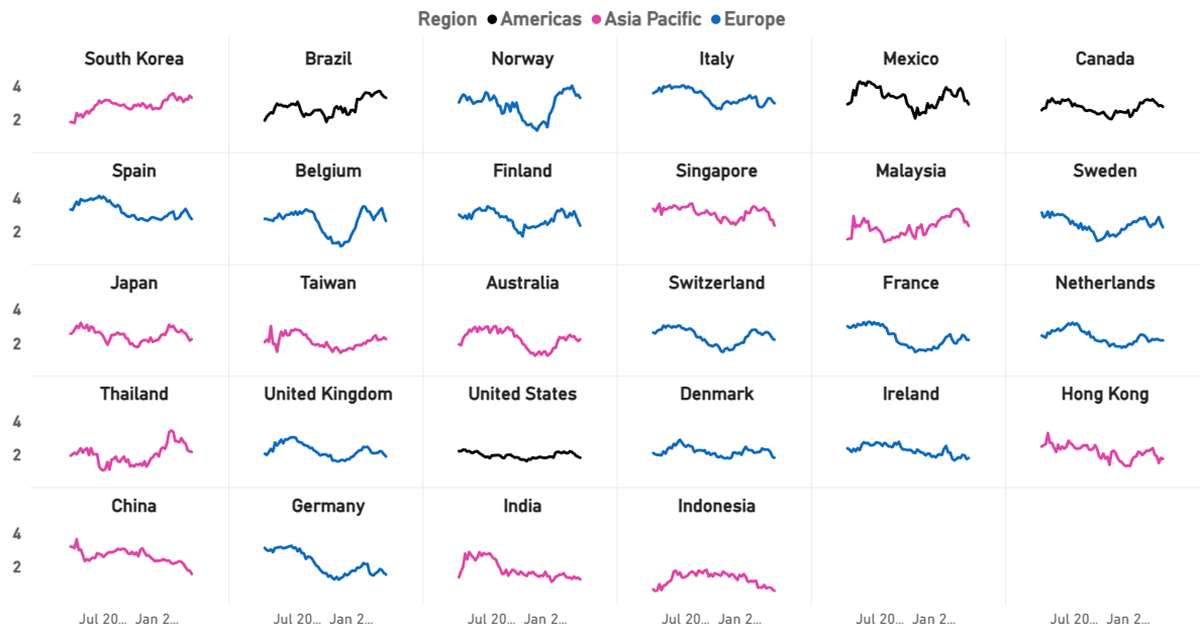
Country Average Trend Score – CAPR - Relative to the World Index
Not a single country has more stocks improving than deteriorating. How is that possible? It’s because the leadership is narrow and the average stock is now lagging the world. It is the sectors and stocks within the market that are driving performance. Those with more energy and chips are doing better than those with less.
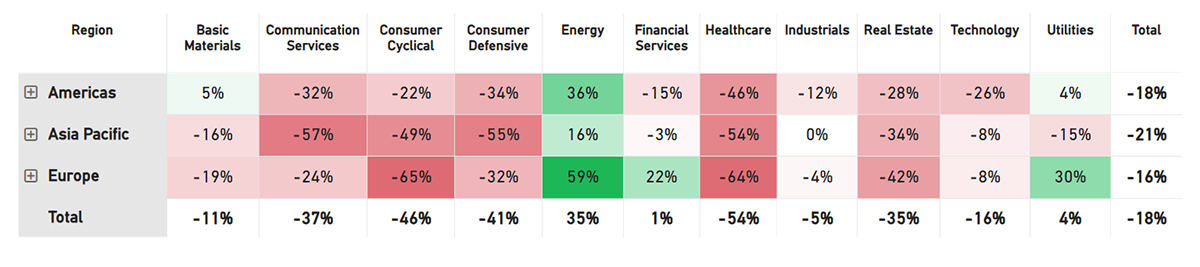
Net Winners - Stay Long Energy
The winners-less-losers metric guides asset allocators. Energy, Utilities, Financial Services, and Industrials remain overweights, while Healthcare, the Consumer, and Real Estate are the underweights.
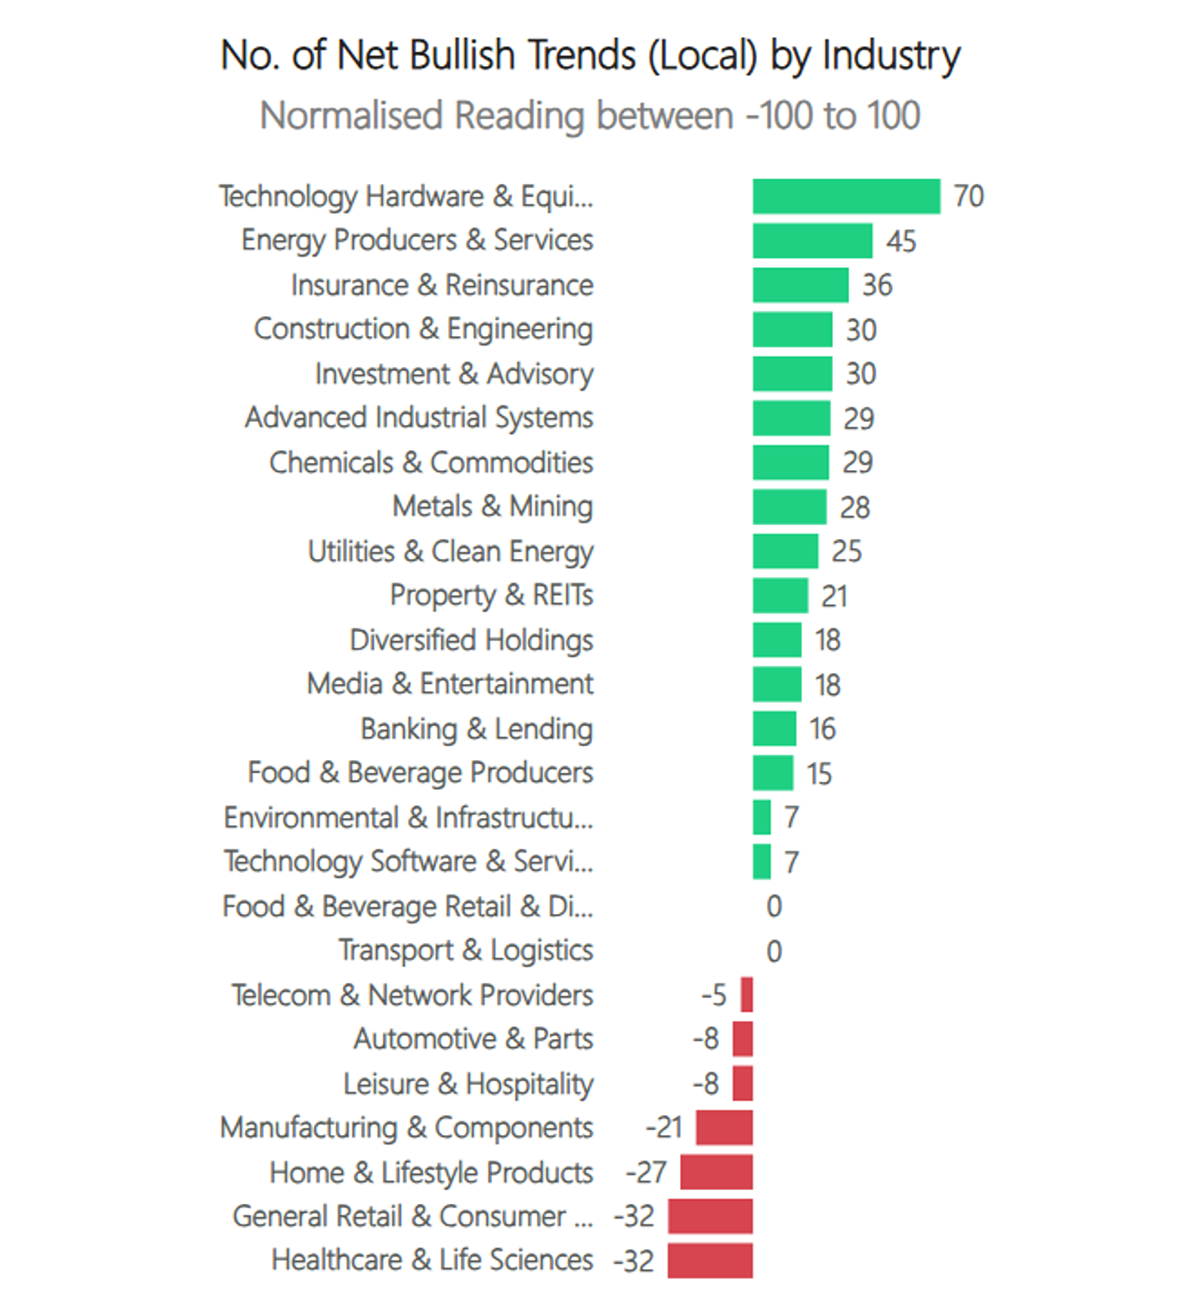
Industry Trend Changes in CAPR – Don’t Touch Luxury
Once again, Technology Hardware drives performance closely followed by Energy. The Consumer is weak.
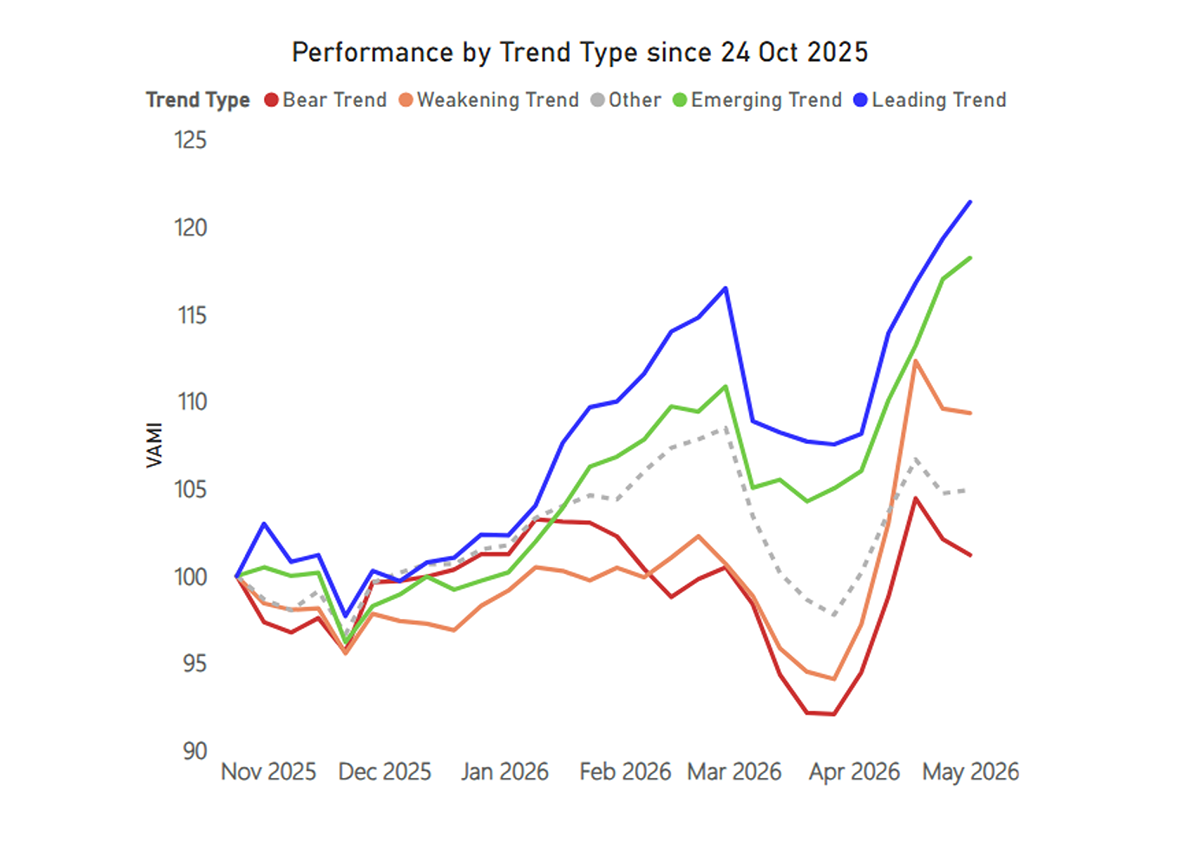
Trend Type Performance
This is still very much a momentum market in relative terms. The winners – Energy, etc. - are holding up, with the losses concentrated within the weak groups. This is not always the case, and if we see a sharp drawdown in equities with a VIX spike, I would expect to see this chart rotate, with the bear stocks rallying while the leaders pull back. It feels much too early for this.
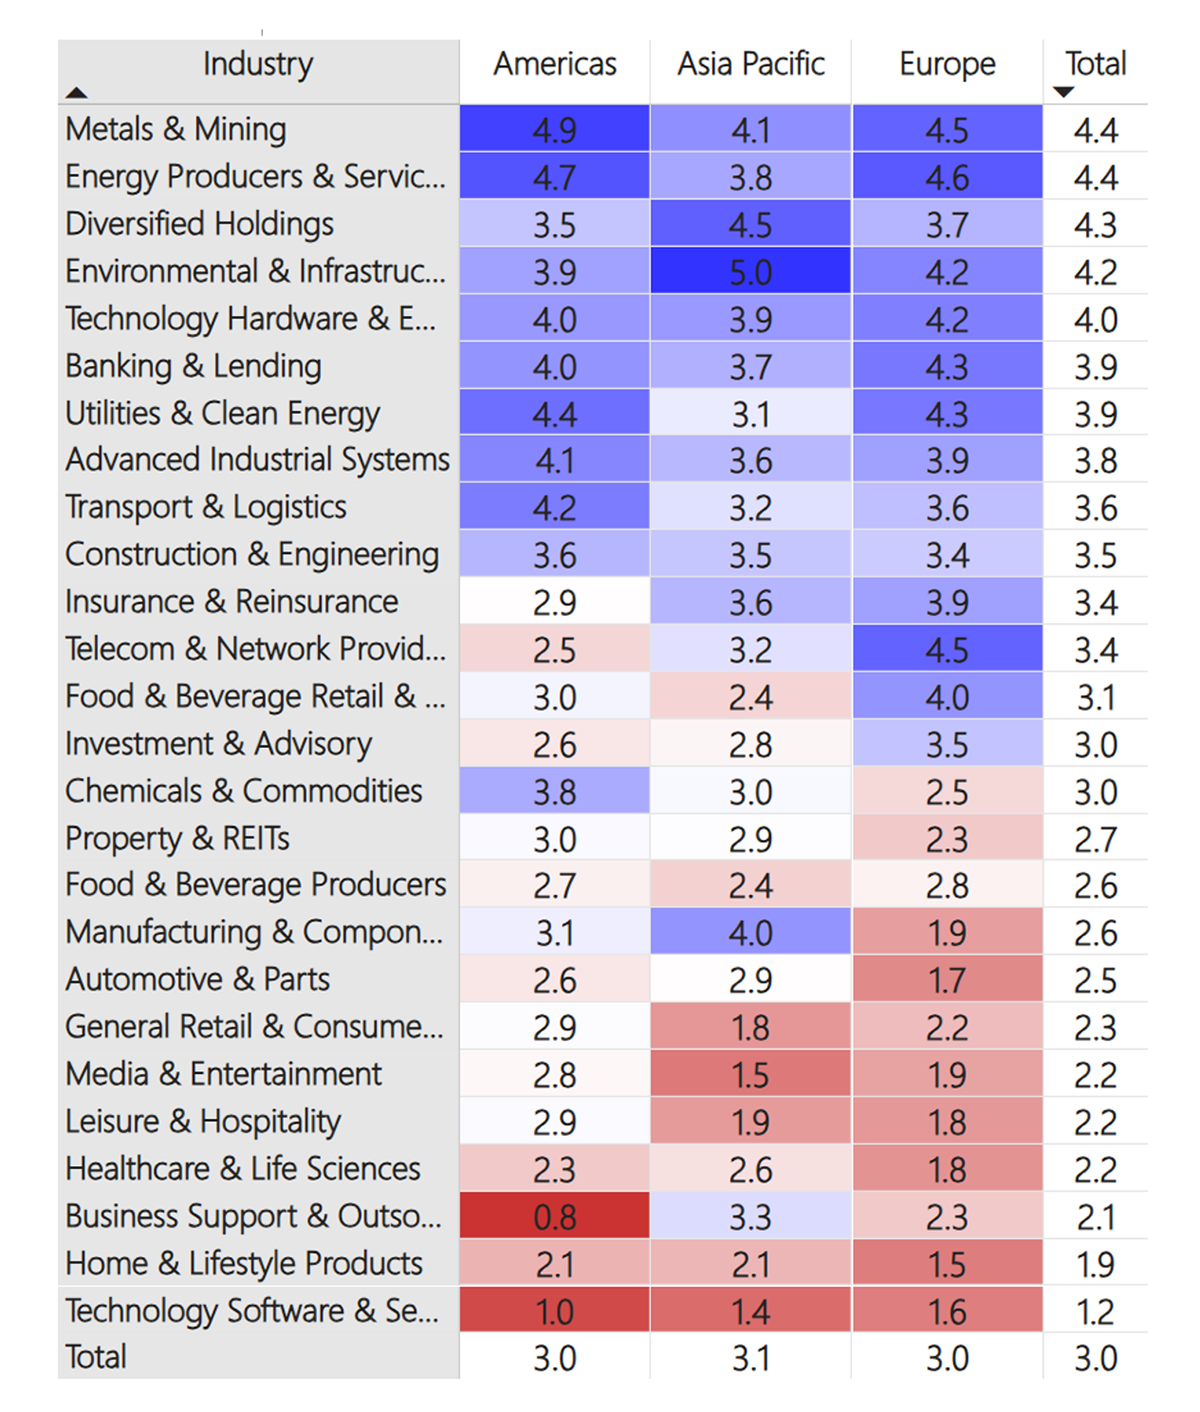
Regions and Industries Average Relative Score
Metals & Mining, especially in America, remains at the top despite weaker precious metals prices. Conversely, Healthcare, Consumer, and Real Estate sectors are underperforming, facing ongoing challenges due to higher interest rate expectations and low consumer confidence. Utilities remain strong, but less so. Additionally, Technology Hardware continues to strengthen, and Home & Lifestyle (luxury) stocks, along with Healthcare and Life Sciences, remain weak as the outlook for recovery is delayed. Transport stocks are also weakening.
User Guide
Refer to our GTI: User Guide for an overview of the key concepts and terminology used in this report. These concepts may take a little bit of getting used to, but they are very powerful once you do.
How to Read the Tables
The Value Composite Score (Value) is measured against the company’s own financial history and not in absolute terms. The columns are Cheap (Chp), Value (Val), Fair Value (FV), Overvalued (OV), and Expensive (Exp). The Growth Composite Score (Growth) is measured by sales, earnings, cash flow, dividends, and book value on a per share basis. The columns are High, Good, Medium (Med), Low, and Negative (Neg).
Leading Trends with New Highs
These stocks are trading at the 30-week CAPR highs with a ByteTrend Score of 5. All charts shown are CAPR rebased to 100.
| Name | Annual Vol 30w | Mkt Cap $Bn | Value | Growth |
| Alphabet Inc. | 35 | 4666 | OV | Good |
| Amazon.com, Inc. | 38 | 2885 | FV | Good |
| Micron Technology, Inc. | 58 | 611 | Exp | Low |
| SK hynix Inc. | 56 | 600 | Exp | High |
| Advanced Micro Devices, Inc. | 73 | 588 | OV | High |
| Intel Corporation | 67 | 501 | Exp | Neg |
| Caterpillar Inc. | 33 | 414 | Exp | Good |
| Cisco Systems, Inc. | 26 | 363 | OV | Low |
| Texas Instruments Incorporated | 42 | 256 | Exp | Neg |
| Royal Bank of Canada | 14 | 251 | OV | Good |
| ABB Ltd | 28 | 182 | OV | High |
| The Toronto-Dominion Bank | 15 | 179 | FV | High |
| Delta Electronics, Inc. | 48 | 178 | Exp | Good |
| Seagate Technology Holdings plc | 66 | 163 | Exp | Neg |
| Western Digital Corporation | 57 | 146 | Exp | Good |
| Tokyo Electron Limited | 40 | 138 | Exp | Med |
| MediaTek Inc. | 62 | 132 | Exp | Good |
| Vertiv Holdings Co | 49 | 126 | Exp | High |
| Quanta Services, Inc. | 34 | 111 | Exp | High |
| Bank of Montreal | 16 | 108 | OV | Good |
| Canadian Imperial Bank of Commerce | 18 | 104 | OV | Good |
| Infineon Technologies AG | 46 | 87 | Exp | Neg |
| Ciena Corporation | 51 | 76 | Exp | Good |
| Nokia Oyj | 43 | 69 | Exp | Med |
| Assicurazioni Generali S.p.A. | 23 | 67 | OV | Good |
| Manulife Financial Corporation | 18 | 66 | OV | High |
| Keysight Technologies, Inc. | 48 | 60 | Exp | Med |
| National Bank of Canada | 19 | 59 | OV | Good |
| Nucor Corporation | 32 | 51 | Exp | Neg |
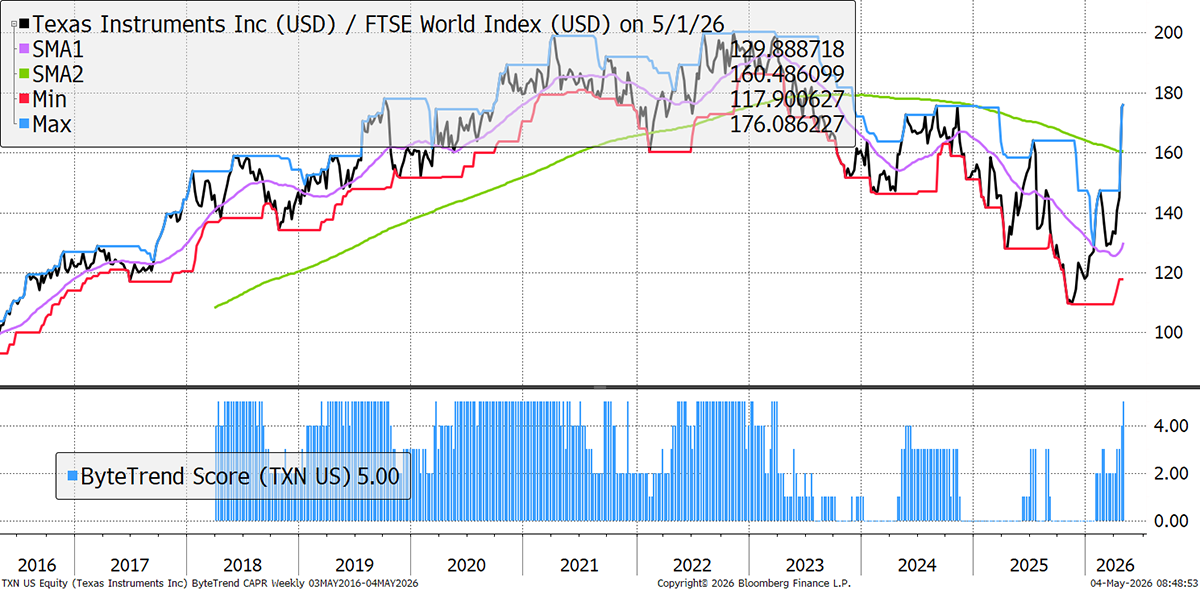
Texas Instruments
The Texas Instruments stock has performed well recently due to robust demand for its semiconductor products, particularly in the industrial and automotive sectors. Strong earnings reports and positive management outlooks have further boosted investor confidence, supporting sustained upward momentum over the past few weeks.
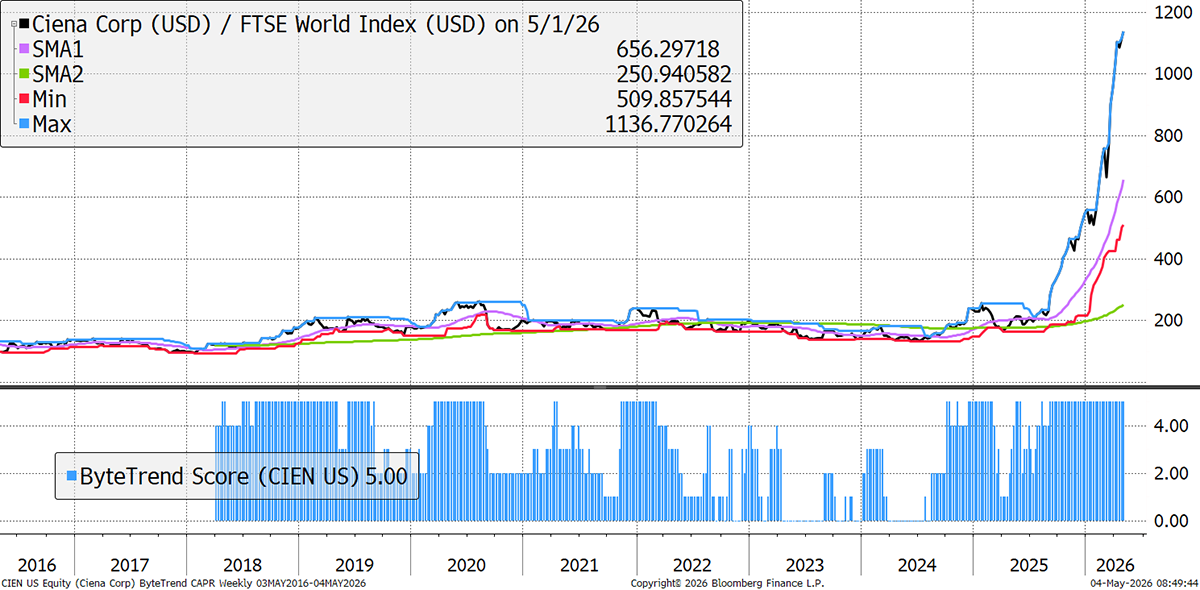
Ciena Corp
Ciena, a data centre and telecom infrastructure provider, has surged over the past year thanks to strong demand for its networking solutions. This has particularly come from telecoms and cloud providers as they ramp up investments in next-generation infrastructure. Consistently positive earnings and expanding global partnerships have further attracted investor attention, fuelling remarkable upward momentum.
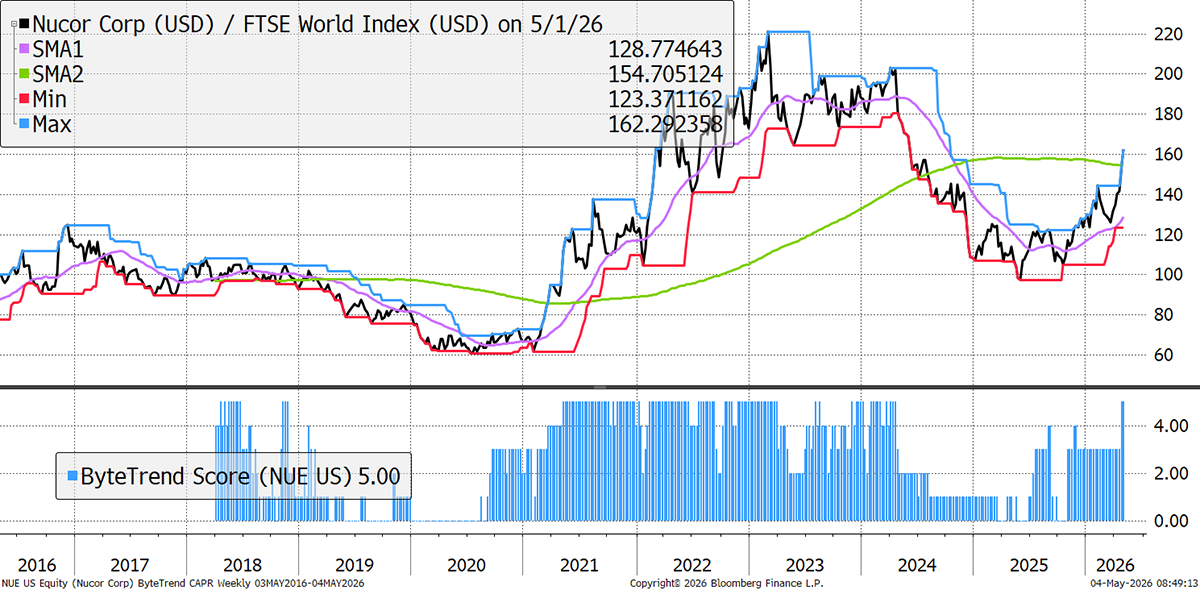
Nucor Corp
Nucor Corp, a leading steel producer, has demonstrated resilient performance in recent months, buoyed by robust demand for steel across the construction and manufacturing sectors. The company’s strategic investments in innovative production technologies and its focus on sustainability have helped maintain its competitive edge, resulting in consistently strong financial results and positive investor sentiment.
New Leading Trends
These stocks are trading at the 30-week CAPR highs with a ByteTrend Score of 5, except they are new trends this week, having previously had a score below 5. All charts shown are CAPR rebased to 100.
| Name | Annual Vol 30w | Mkt Cap $Bn | Value | Growth |
| Altria Group, Inc. | 31 | 125 | OV | Med |
| Shin-Etsu Chemical Co., Ltd. | 31 | 84 | OV | Neg |
| NXP Semiconductors N.V. | 51 | 75 | OV | Neg |
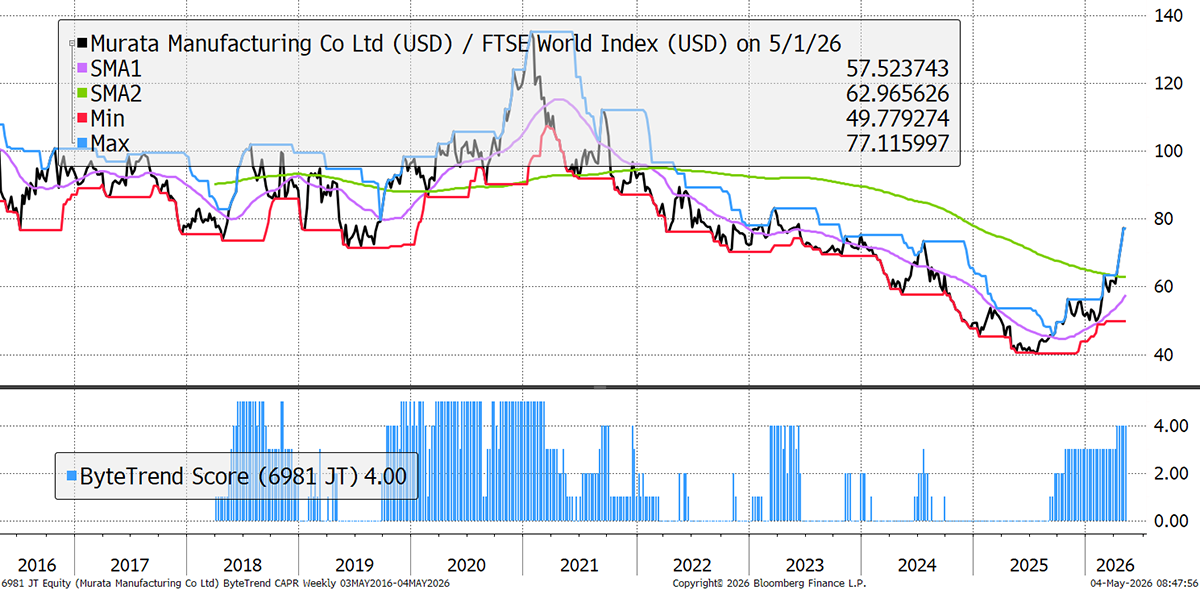
| Murata Manufacturing Co., Ltd. | 42 | 60 | OV | Good |
Murata Manufacturing
Murata Manufacturing has consistently demonstrated its ability to innovate within the electronics industry, offering a diverse portfolio of components that cater to both traditional and emerging market needs. The company’s focus on quality and reliability has contributed to its strong reputation among global manufacturers, making it a preferred supplier for advanced solutions in automotive, telecommunications, and consumer electronics.
Emerging Trends
These stocks are trading at the 30-week CAPR highs with a ByteTrend Score of less than 5. They don’t have to be in an uptrend, just emerging. All charts shown are CAPR rebased to 100.
| Name | Annual Vol 30w | Mkt Cap $Bn | Value | Growth |
| Keyence Corporation | 42 | 118 | FV | Good |
| The Bank of Nova Scotia | 16 | 96 | FV | Med |
| Carrier Global Corporation | 36 | 56 | OV | High |
| Microchip Technology Incorporated | 55 | 51 | Exp | Neg |
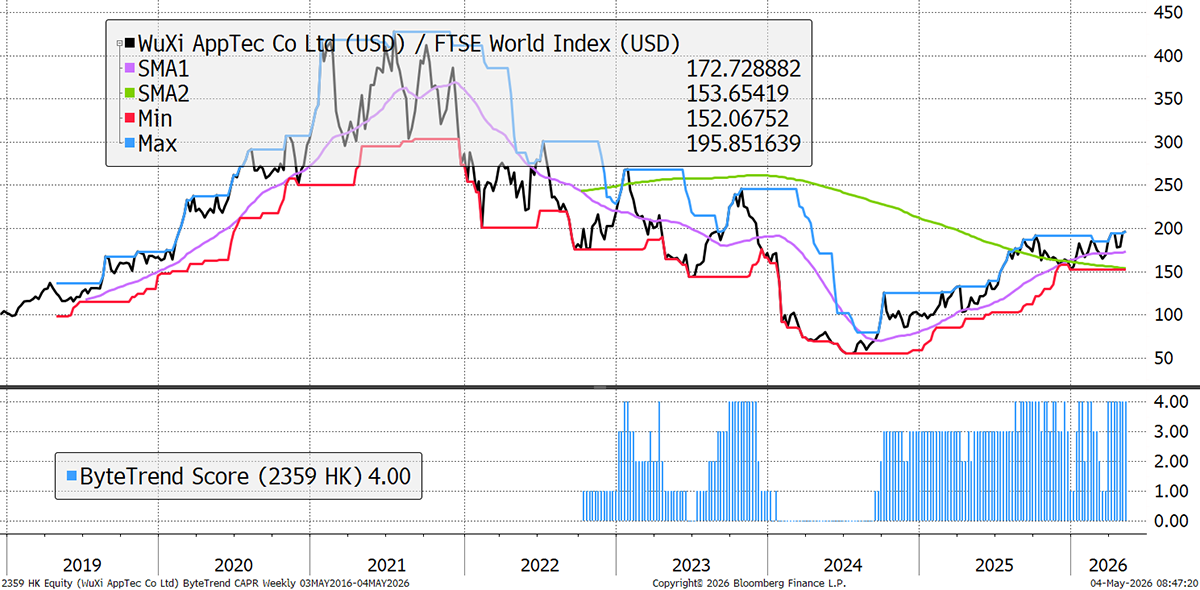
| WuXi AppTec Co., Ltd. | 42 | 50 | Val | High |
| Daikin Industries,Ltd. | 27 | 43 | FV | Good |
WuXi AppTec
WuXi AppTec is a global contract research, development, and manufacturing organisation for the pharmaceutical industry. It is part of a new wave of advanced healthcare technology companies based in China. Its core CRDMO (Contract Research, Development, and Manufacturing Organisation) business is growing strongly again, with revenue and profit rising sharply in 2025 and early 2026, and a large backlog suggesting that will continue.
Weakening
These stocks are trading at the 30-week CAPR lows with a ByteTrend Score above 0. They are weakening trends but not yet downtrends. All charts shown are CAPR rebased to 100.
| Name | Annual Vol 30w | Mkt Cap $Bn | Value | Growth |
| GE Aerospace | 33 | 299 | Exp | High |
| International Business Machines Corporation | 36 | 218 | OV | High |
| SAP SE | 33 | 199 | FV | High |
| Intuitive Surgical, Inc. | 40 | 162 | FV | High |
| Hitachi, Ltd. | 35 | 137 | Exp | Good |
| Safran S.A. | 33 | 133 | OV | High |
| Capital One Financial Corporation | 32 | 119 | OV | Low |
| The Progressive Corporation | 23 | 117 | FV | High |
| Zurich Insurance Group AG | 21 | 104 | OV | Good |
| McKesson Corporation | 30 | 100 | OV | High |
| HCA Healthcare, Inc. | 28 | 96 | FV | Good |
| Xiaomi Corporation | 31 | 96 | FV | High |
| Royal Caribbean Cruises Ltd. | 45 | 72 | FV | High |
| Nu Holdings Ltd. | 34 | 70 | FV | High |
| Cintas Corporation | 24 | 68 | OV | Good |
| TransDigm Group Incorporated | 29 | 65 | FV | High |
| TE Connectivity Ltd. | 38 | 61 | FV | Good |
| Deutsche Bank AG | 32 | 59 | FV | High |
| Cencora, Inc. | 25 | 59 | Exp | Med |
| Thales S.A. | 37 | 56 | OV | Med |
| UCB S.A. | 31 | 52 | OV | High |
| Electronic Arts Inc. | 4 | 51 | OV | Med |
| Discover Financial Services | 0 | 50 |
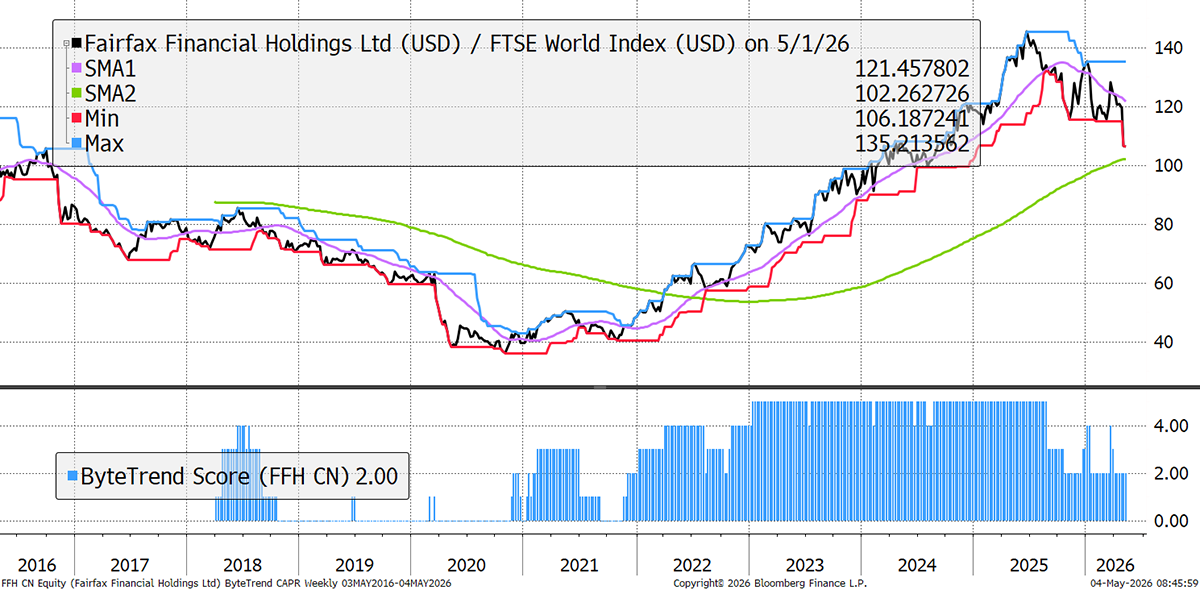
Fairfax Financial
After an incredible run of growth, insurance company Fairfax has hit a wall. Q1 2026 net income fell year over year due to investment losses. Rising interest rates led to their large bond holdings, which are marked to market, dragging down the value of their investment portfolio. Meanwhile, revenue growth has slowed in recent quarters.
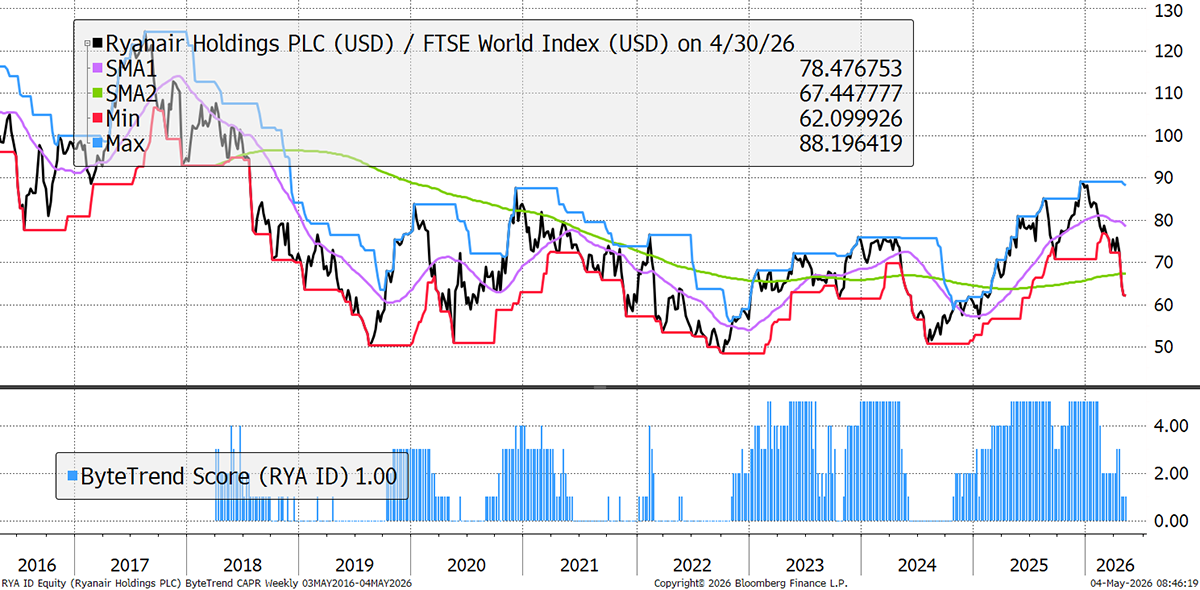
Ryanair
Airline stocks are seeing flight cancellations and higher costs – a nightmare scenario. Ryanair is famous for profiting from industry crises, as less efficient rivals suffer more, and it can invest while others must cut. However, in the meantime, the financial impact in the short term is unavoidable.
Bear Trends
These stocks are trading at the 30-week CAPR lows with a ByteTrend Score of 0. They are in a downtrend. All charts shown are CAPR rebased to 100.
| Name | Annual Vol 30w | Mkt Cap $Bn | Value | Growth |
| Berkshire Hathaway Inc. | 15 | 1021 | OV | Good |
| Tencent Holdings Limited | 25 | 540 | Val | High |
| Mastercard Incorporated | 21 | 439 | FV | Good |
| The Home Depot, Inc. | 25 | 323 | FV | Low |
| Alibaba Group Holding | 39 | 309 | Chp | Good |
| LVMH | 31 | 262 | Val | Low |
| Toyota Motor Corporation | 31 | 249 | OV | High |
| McDonald's Corporation | 17 | 204 | FV | Med |
| Hermès International | 29 | 200 | FV | Good |
| The Walt Disney Company | 23 | 183 | FV | High |
| Thermo Fisher Scientific Inc. | 30 | 174 | FV | Med |
| Abbott Laboratories | 22 | 155 | Val | Med |
| China Merchants Bank | 21 | 152 | FV | Med |
| Lowe's Companies, Inc. | 28 | 131 | FV | Med |
| HDFC Bank Limited | 19 | 126 | Val | High |
| Danaher Corporation | 27 | 124 | Val | Neg |
| Sony Group Corporation | 31 | 119 | OV | Good |
| Stryker Corporation | 26 | 113 | FV | Good |
| Sanofi | 21 | 113 | FV | Low |
| Accenture plc | 37 | 111 | Val | Med |
| Vertex Pharmaceuticals | 24 | 108 | FV | Low |
| Prosus N.V. | 36 | 105 | Val | High |
| Medtronic plc | 21 | 103 | Val | Low |
| EssilorLuxottica S.A. | 37 | 98 | FV | Med |
| ICICI Bank Limited | 21 | 96 | FV | High |
| Christian Dior SE | 30 | 90 | ||
| Marsh & McLennan Companies | 19 | 90 | ||
| Intercontinental Exchange, Inc. | 26 | 88 | FV | Good |
| Boston Scientific Corporation | 38 | 84 | Val | High |
| Northrop Grumman Corporation | 29 | 81 | FV | Good |
| The Sherwin-Williams Company | 25 | 78 | FV | Good |
| Postal Savings Bank of China | 18 | 77 | FV | Neg |
| 3M Company | 32 | 74 | FV | Neg |
| Illinois Tool Works Inc. | 25 | 74 | FV | Med |
| Ecolab Inc. | 24 | 73 | FV | Good |
| Aon plc | 21 | 67 | FV | Med |
| Hong Kong Exchanges | 18 | 67 | Val | High |
| Deutsche Post AG | 0 | 66 | FV | Neg |
| NIKE, Inc. | 39 | 66 | FV | Neg |
| Republic Services, Inc. | 18 | 64 | FV | Good |
| Deutsche Post AG | 0 | 63 | FV | Neg |
| KDDI Corporation | 18 | 62 | FV | Low |
| Merck KGaA | 31 | 56 | Val | Neg |
| Hindustan Unilever | 19 | 56 | FV | Med |
| Nintendo Co., Ltd. | 43 | 56 | FV | Neg |
| Mercedes-Benz Group AG | 25 | 56 | FV | Neg |
| Bayerische Motoren Werke | 32 | 55 | FV | Neg |
| Wal-Mart de México | 22 | 55 | Val | Neg |
| Arthur J. Gallagher & Co. | 34 | 54 | FV | Med |
| Sea Limited | 42 | 53 | Chp | High |
| Volkswagen AG | 27 | 52 | Val | Neg |
| Volkswagen AG | 28 | 51 | Val | Neg |
| Danone S.A. | 22 | 50 | FV | Good |
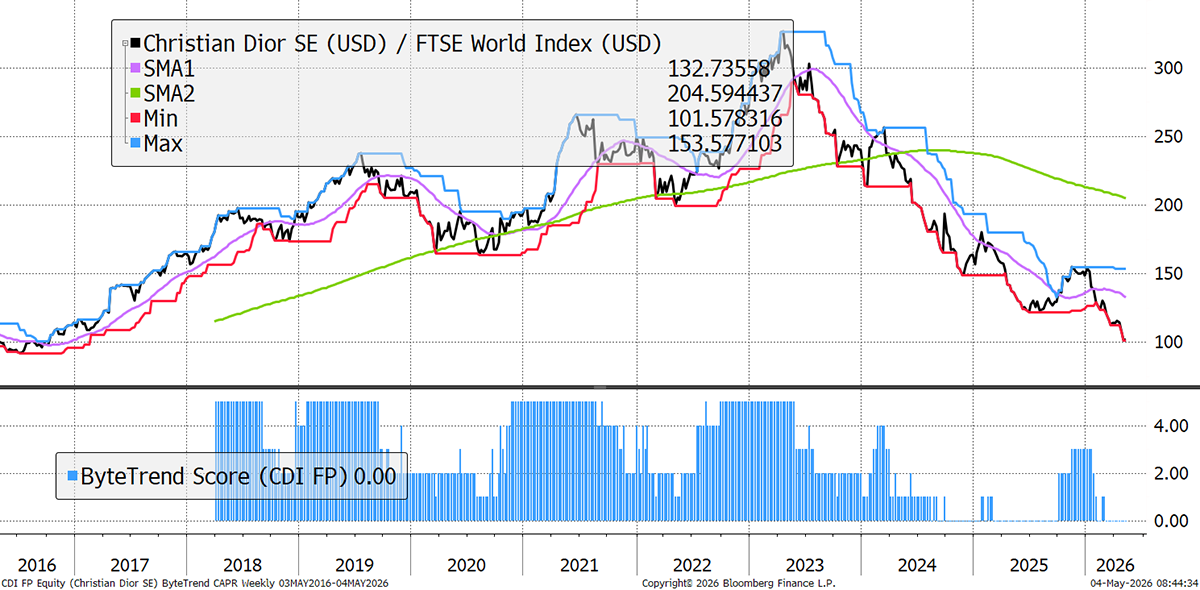
Christian Dior
The luxury bear market shows no signs of ending. Even LVMH are considering joining the herd in “managing the portfolio” – i.e. selling off underperforming brands. As for Dior, revenue growth turned negative in late 2024 and hasn’t fully recovered since, while the valuations it reached in 2021 were the highest since 1999 – a bad starting point. These have now been cut in half, but the bustiness is yet to show convincing signs of a return to growth.
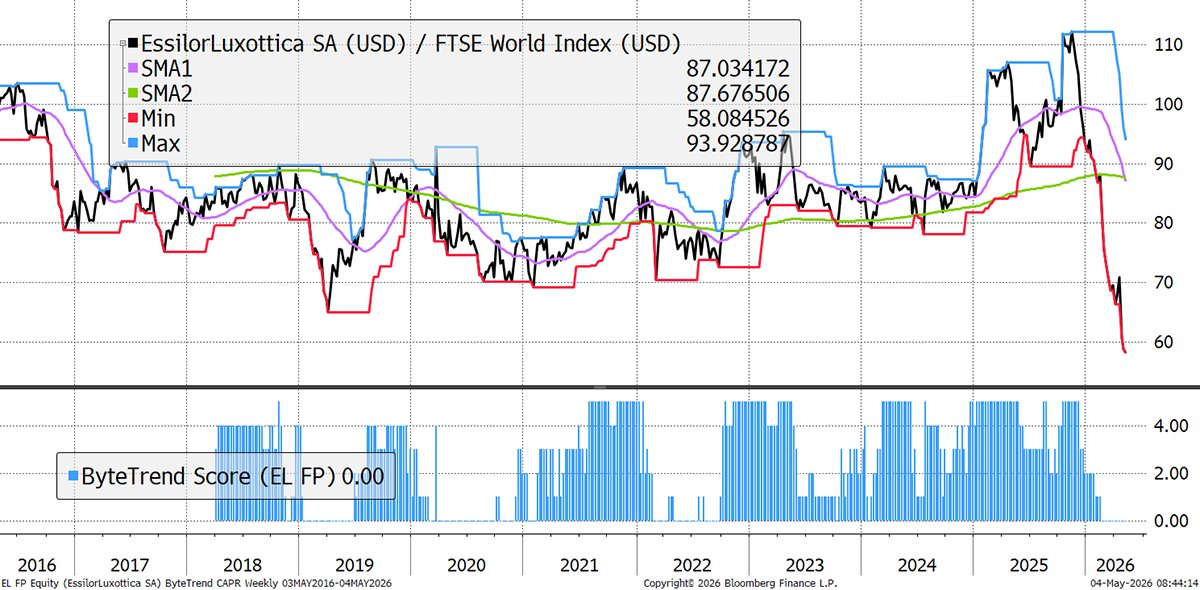
EssilorLuxottica
EL has collapsed, with the stock price falling 47% in the last six months. Part of their growth story was smart glasses, but the tech companies are encroaching on their opportunity and eroding their competitive moat. Sales and free cash flow are actually re-accelerating, but investors are still digesting the record valuations it reached last year, especially during a broader luxury bear market.
GTI 200 Spreadsheet
We are pleased to share the GTI 200 spreadsheet. Download the spreadsheet below to view the CAPR and local currency scores, and more, for the world’s largest 200 stocks. Have a look at the different groups and the main list “All stocks”. The Insights tab is interesting, and don’t forget to expand the columns by clicking on the “+” at the top of the page if you want to see more trend data.
Outlook
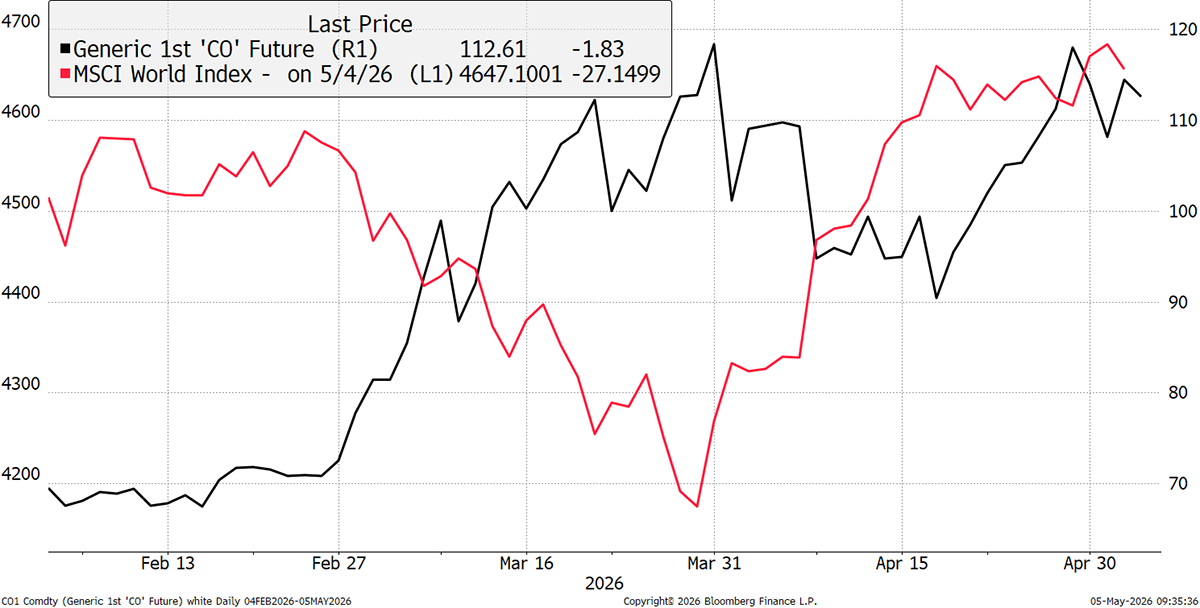
The leadership is thinning, but this still looks like a bull market. The primary risk is the oil price, which, with the Strait under pressure again, could derail the rally.
Equities vs Oil
Thanks for reading GTI.


