


Issue 74;
- The jaws continue to bite as the leading tech stocks suffer.
- Rotation into defensive themes.
- Financials and Energy provide sanctuary.
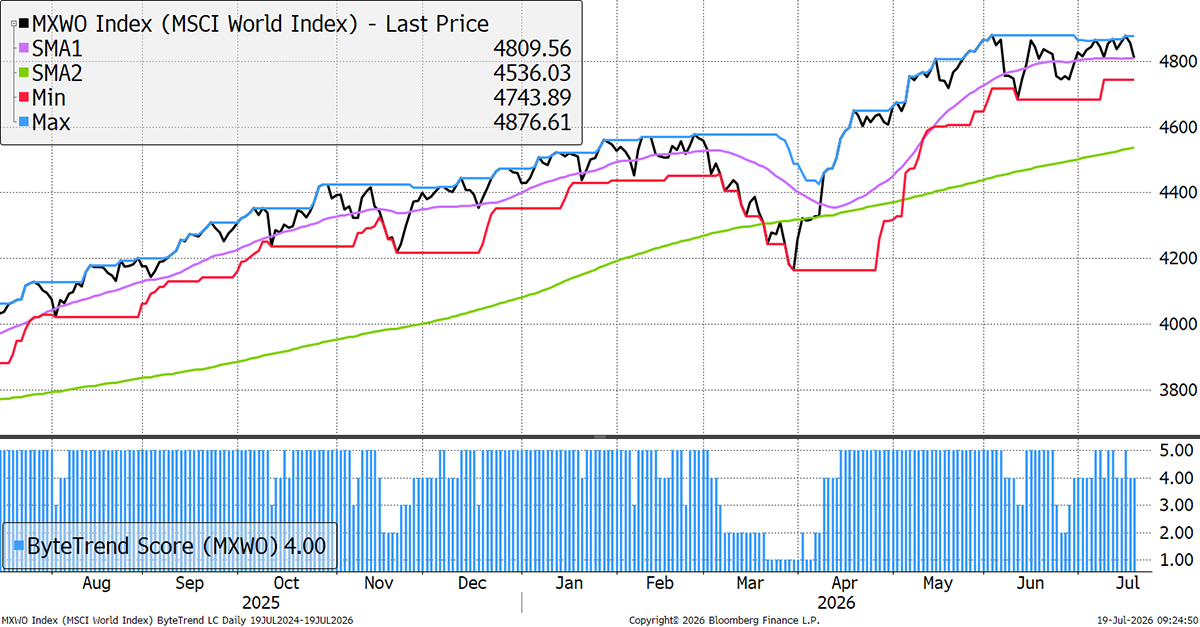
The World Index drops to a ByteTrend Score of 4 in USD. The price is just below the 30-day moving average.
World Index – Developed Markets – Daily
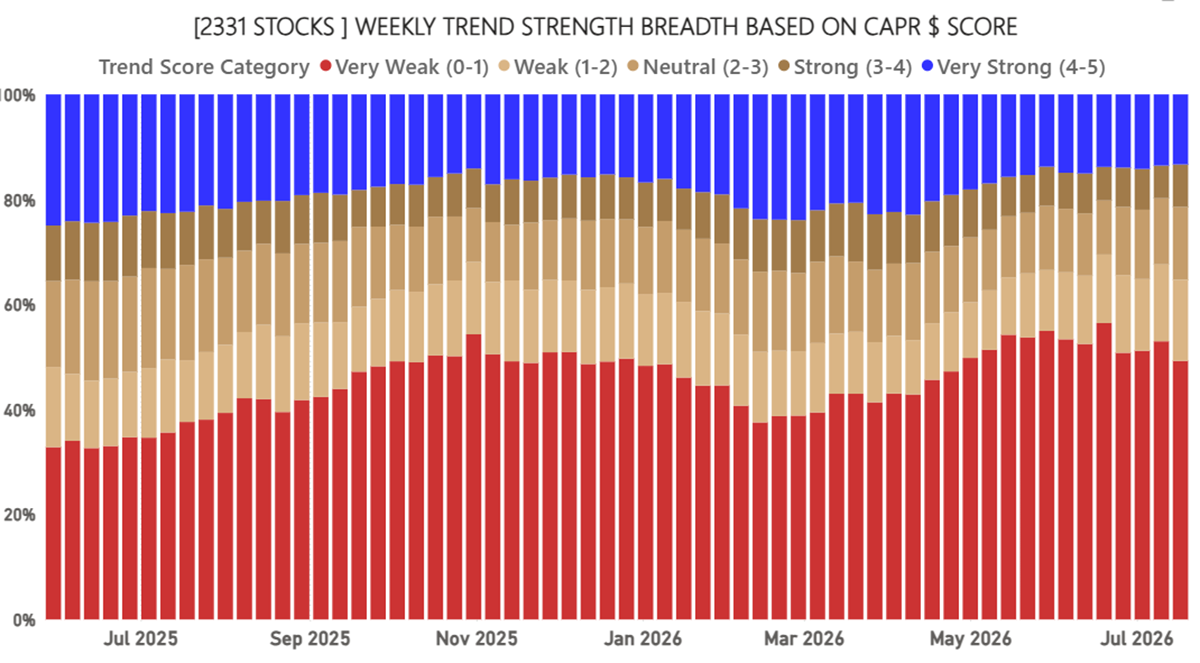
Global Equity Breadth – CAPR
Although price breadth remains healthy, CAPR breadth continues to thin. That said, the neutral zone has widened as the bear trends fade.
Now that the AI trade is in correction mode, the leadership is even narrower. In this week’s stocks section, we highlight leading banks, some software, oil refining amid the Iran war’s reignition, and some REITs.
Net Winners
The winners-less-losers metric guides asset allocators. The banks are back with force, boosting their established leadership. This week also saw renewed vigour in energy stocks as the war in Iran resumed.
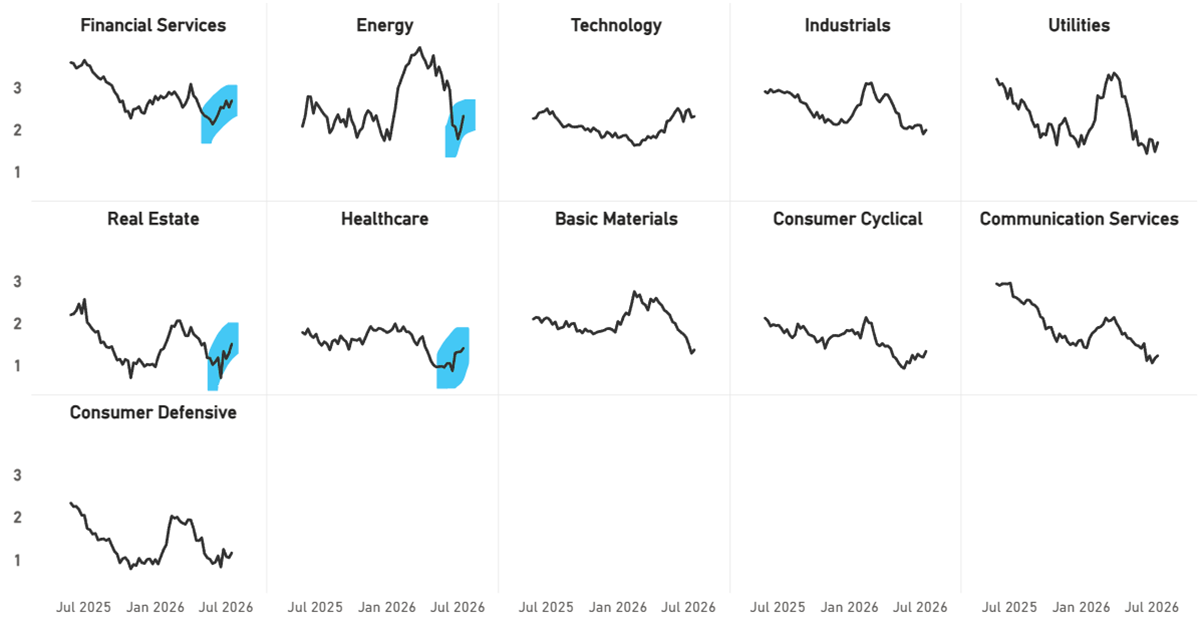
Sector Average Trend Score CAPR
The other sector worth mentioning is Real Estate, where the recovery is real. Healthcare is also an emerging contender, but these are still early days. What is clear is that, among the traditional defensive sectors, these have been the first to respond to the closing jaws; i.e. as tech hardware slides back, these sectors benefit.
Trend Type Performance in CAPR
As the performance jaws close, it means the weakest stocks are less likely to fall in CAPR terms. The chip stocks are worth trillions, so a little easing in them is well received across the rest of the market. There are even some new uptrends, mainly from Financials and Energy.
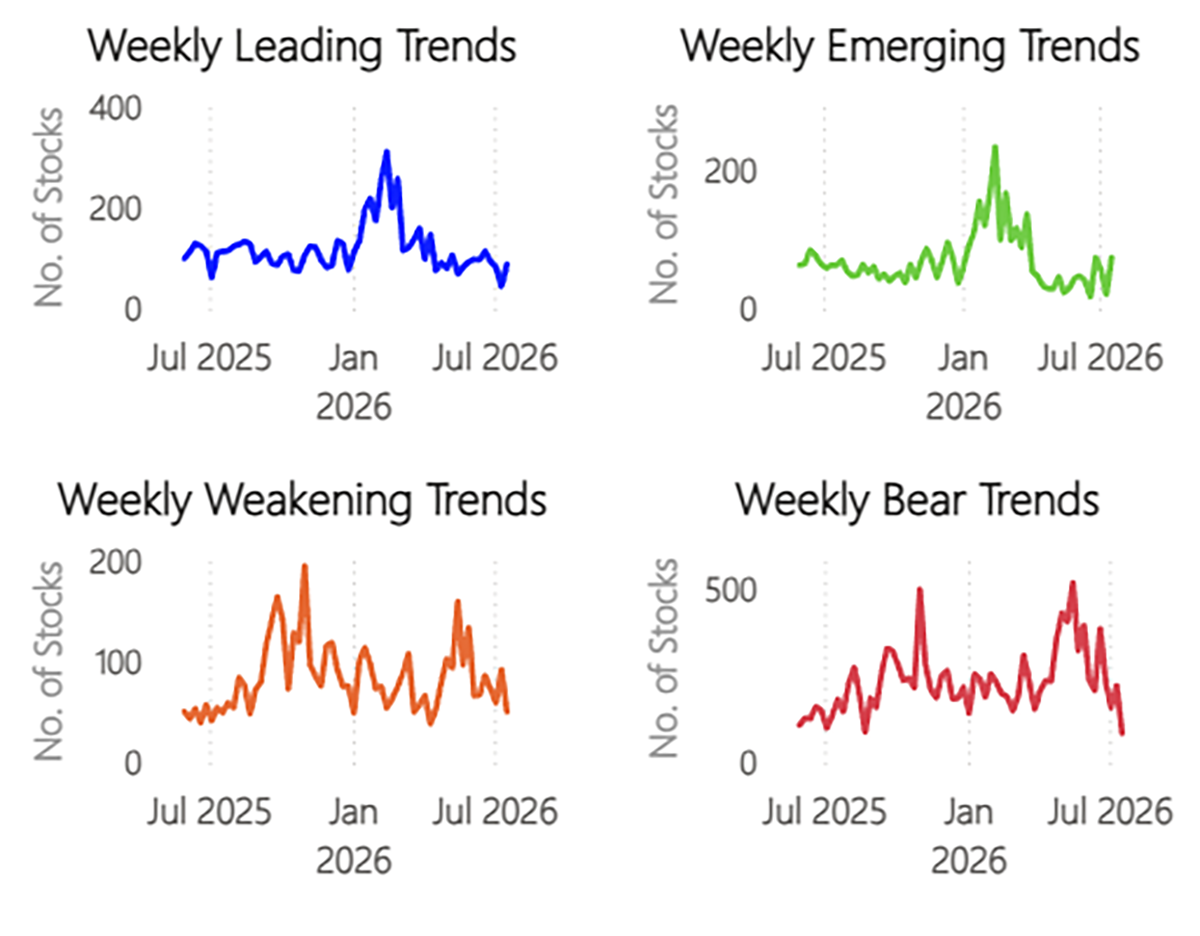
As you can see below, the jaws are closing. The emerging vs weakening trends (green vs orange) have already closed, but the leaders vs bear trends ( blue vs red) are just getting started. This last happened on such a scale in March 2000 and in November 2007.
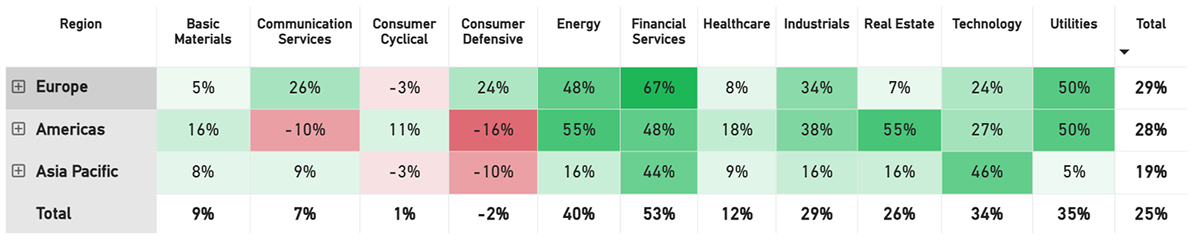
Regions and Industries Average Relative Score
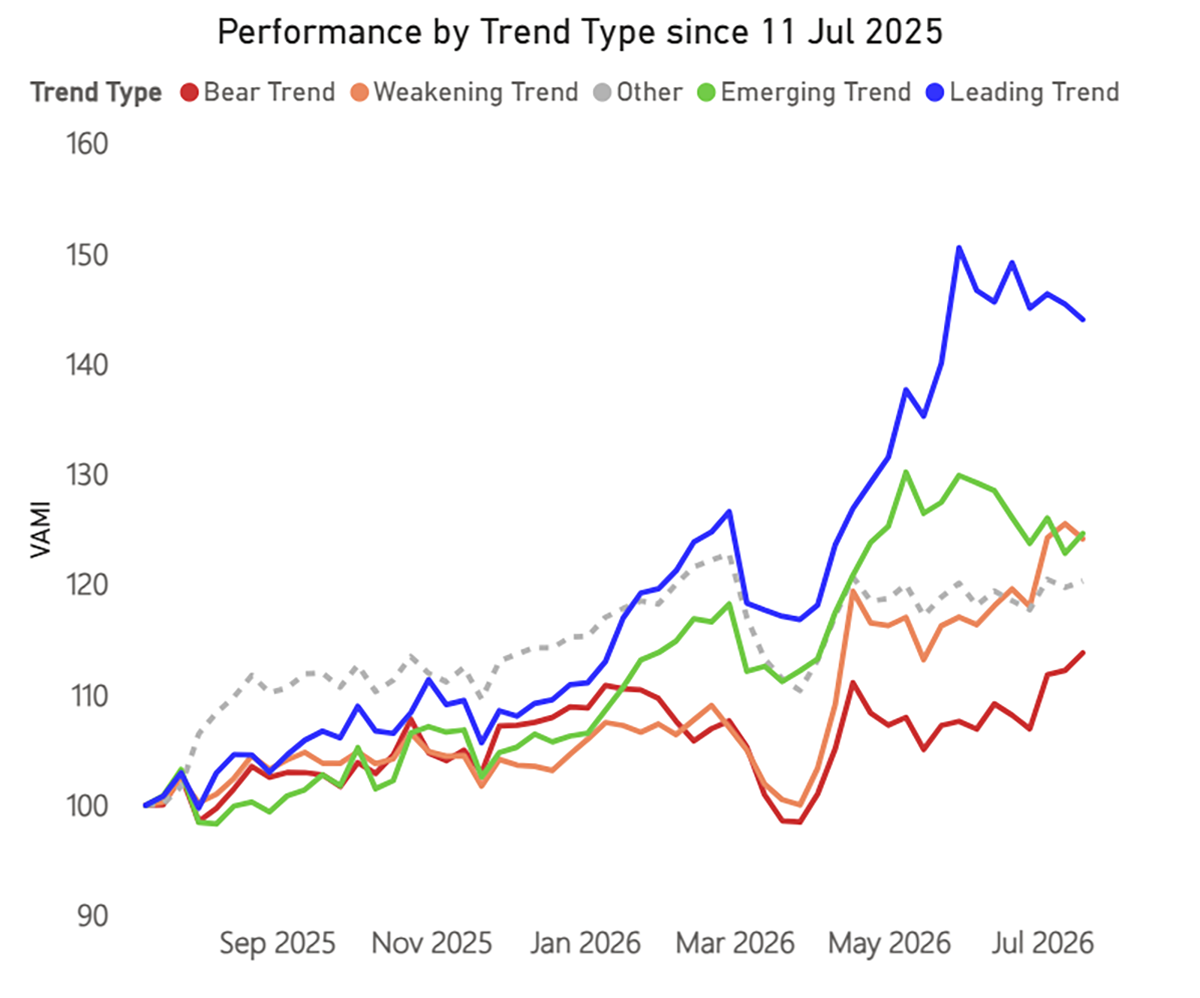
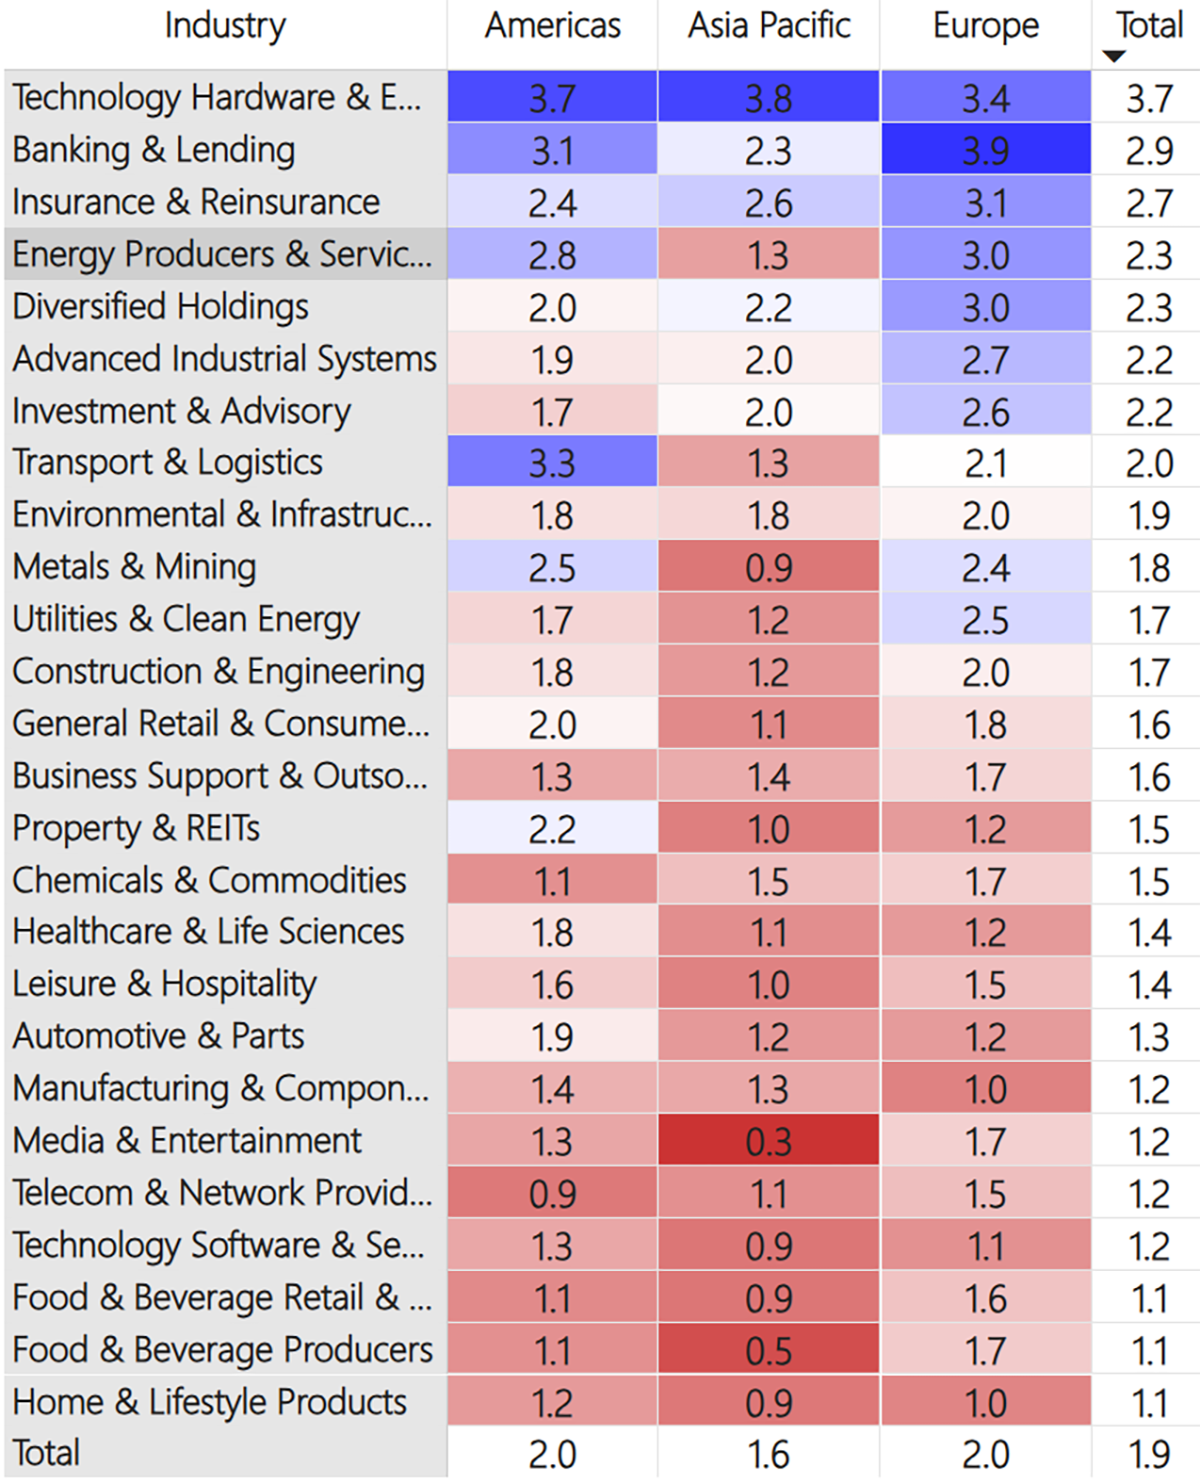
This table (below) shows the average CAPR score for each global industry, by region and in total.
Tech Hardware continued to weaken, as fears about valuation, concentration, and spending ran into Korean margin calls and China’s impressive Moonshot / Kimi model releases. Tech Hardware dominates the index, so as it falls, all other sectors see strength relative to the index, on top of the fact that capital flowing out of tech goes back into other areas, boosting them.
Banking & Lending continued to recover, as large US banks reported strong results due to large fundraising activity, such as the SpaceX IPO. Energy Producers bounced as the Hormuz crisis heats up again. Transport & Logistics stocks picked up, especially in the US, and at the bottom of the table, Home & Lifestyle (luxury) bounced a little as the AI boom creates more millionaires and jewellery, in particular, sees strong demand.
In the Americas, Property & REITs continue their impressive run, and Investment & Advisory stocks are picking up too. In Europe, it’s the banks leading the way, and in Asia, Construction & Engineering and Advanced Industrials are fading fast; a red flag for the economy there.
User Guide
Refer to our GTI: User Guide for an overview of the key concepts and terminology used in this report. These concepts may take a little bit of getting used to, but they are very powerful once you do.
Leading Trends with New Highs
These stocks are trading at the 30-week CAPR highs with a ByteTrend Score of 5. All charts shown are CAPR rebased to 100.
| Name | Annual Vol 30w | Mkt Cap $Bn | Industry |
| Apple Inc. | 28 | 4902 | Technology Hardware |
| HSBC Holdings plc | 27 | 345 | Banking & Lending |
| Royal Bank of Canada | 14 | 299 | Banking & Lending |
| Palo Alto Networks, Inc. | 54 | 244 | Technology Software & Services |
| Mitsubishi UFJ Financial Group, | 29 | 241 | Banking & Lending |
| CrowdStrike Holdings, Inc. | 57 | 207 | Technology Software & Services |
| The Toronto-Dominion Bank | 15 | 204 | Banking & Lending |
| Allianz SE | 22 | 184 | Insurance & Reinsurance |
| Welltower Inc. | 25 | 172 | Property & REITs |
| UBS Group AG | 26 | 160 | Banking & Lending |
| DBS Group Holdings Ltd | 16 | 158 | Banks |
| BNP Paribas S.A. | 27 | 128 | Banking & Lending |
| Bank of Montreal | 17 | 127 | Banking & Lending |
| Fortinet, Inc. | 51 | 118 | Technology Software & Services |
| Canadian Imperial Bank | 19 | 112 | Banking & Lending |
| Recruit Holdings | 51 | 110 | Business Support & Outsourcing |
| The Bank of Nova Scotia | 18 | 110 | Banking & Lending |
| AXA S.A. | 24 | 105 | Insurance & Reinsurance |
| Oversea-Chinese Banking | 18 | 99 | Banking & Lending |
| Cloudflare, Inc. | 61 | 99 | Technology Software & Services |
| Monster Beverage | 27 | 95 | Food & Beverage Producers |
| Barclays PLC | 30 | 94 | Banking & Lending |
| ING Groep N.V. | 27 | 93 | Banking & Lending |
| Datadog, Inc. | 78 | 92 | Technology Software & Services |
| Valero Energy Corporation | 37 | 92 | Energy Producers & Services |
| Marathon Petroleum | 40 | 91 | Energy Producers & Services |
| The Travelers Companies, Inc. | 23 | 78 | Insurance & Reinsurance |
| Manulife Financial | 20 | 72 | Insurance & Reinsurance |
| W.W. Grainger, Inc. | 25 | 66 | Construction & Engineering |
| The Allstate | 25 | 64 | Insurance & Reinsurance |
| National Bank of Canada | 21 | 64 | Banking & Lending |
| Standard Chartered PLC | 32 | 62 | Banking & Lending |
| Great-West Lifeco Inc. | 17 | 60 | Insurance & Reinsurance |
| Fifth Third Bancorp | 30 | 53 | Banking & Lending |
| State Street Corporation | 21 | 51 | Investment & Advisory |
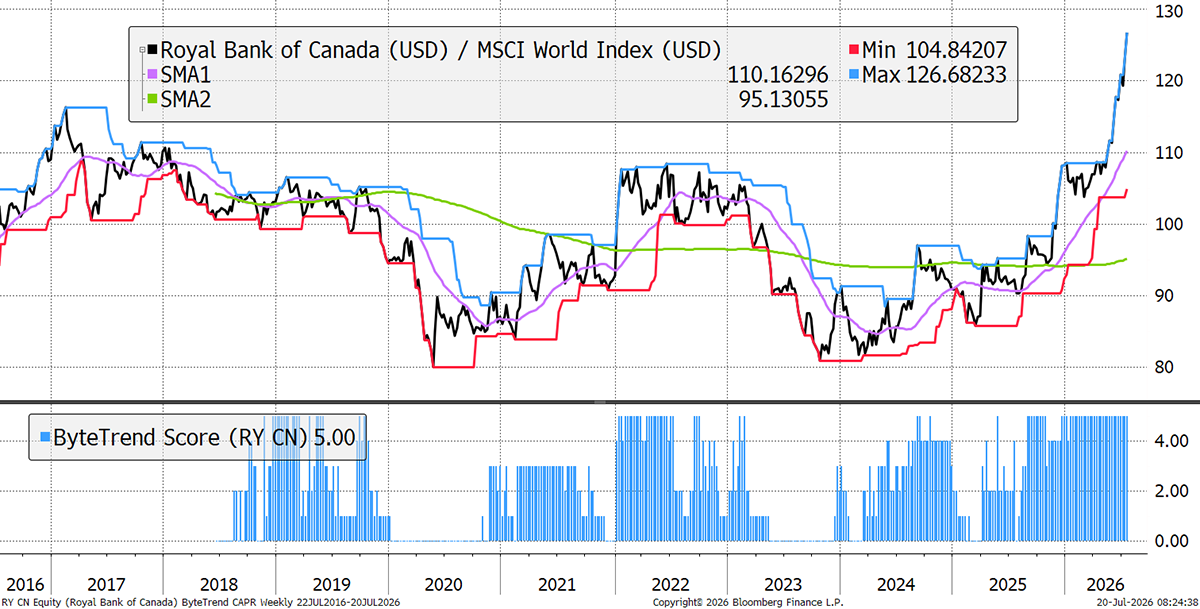
Royal Bank of Canada
Royal Bank of Canada was initially picked up by Global Trends a year ago, when it first hit a CAPR score of 5 in the Autumn. RBC is a strong validation of what we are trying to do here: highlight strong trends early in their life. Canada benefited from gold exposure last year and oil exposure this year, leading RBC to report 25% EPS growth, driven by strong commercial banking activity and backed by a strong balance sheet.
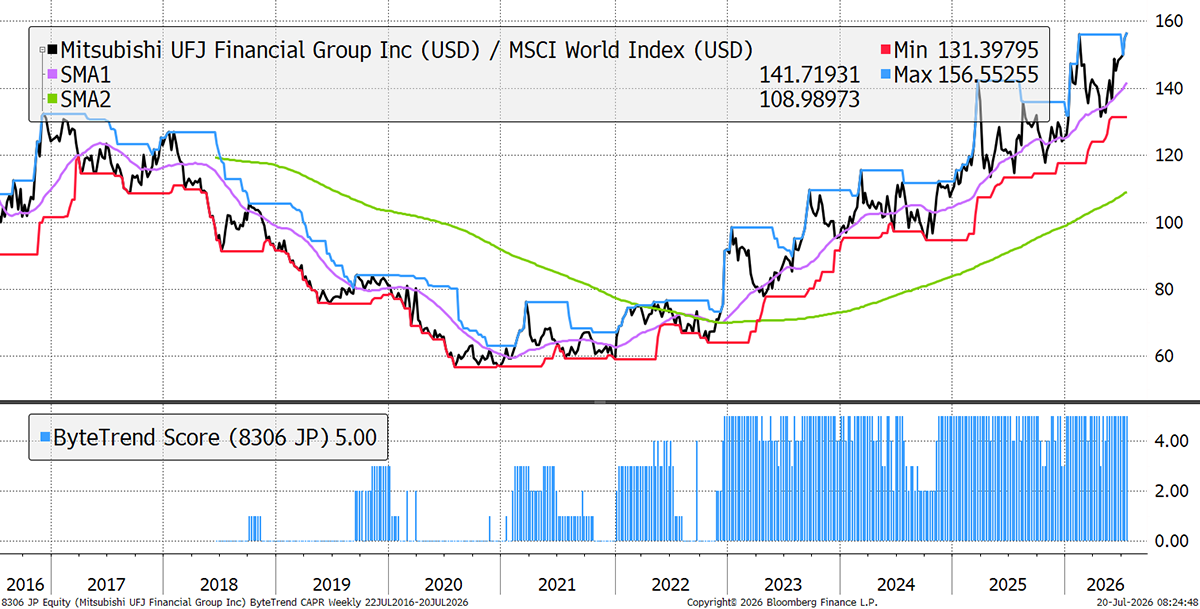
Mitsubishi UFJ Financial Group
MUFG is Japan’s largest megabank and one of the largest in the world by assets. As inflation normalises and rates slowly creep higher, lending has increased. Also, the bull market in Japanese stocks has driven higher fundraising and dealmaking, leading to strong growth in fees and commissions. The Price/Book ratio has gone from 0.3x to 2x.
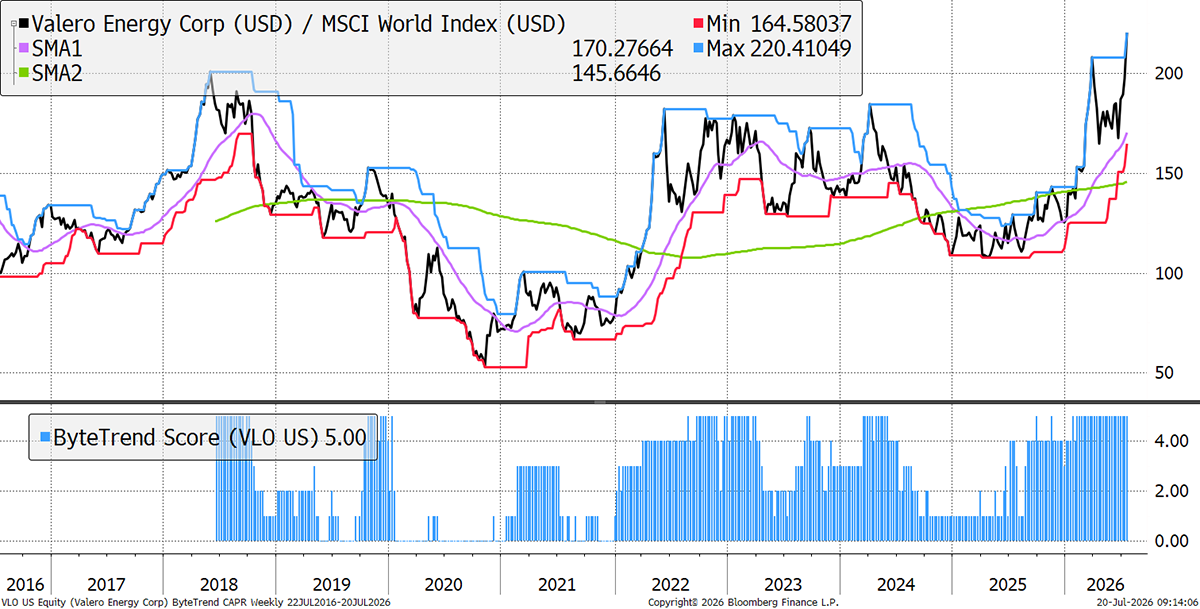
Valero
Within energy, the refiners are the strongest group. US refining margins recently reached all-time highs, with the benchmark US 3-2-1 crack spread surging to approximately $70 per barrel. Valero has operations in the Gulf between Mexico and America, making it well-positioned to receive discounted heavy sour crude from Venezuela. Export demand is also strong at the moment. An incident at Port Arthur has been resolved, and capex is steady, allowing high margins to flow through to shareholders.
New Leading Trends
These stocks are trading at the 30-week CAPR highs with a ByteTrend Score of 5, except they are new trends this week, having previously had a score below 5. All charts shown are CAPR rebased to 100.
| Name | Annual Vol 30w | Mkt Cap $Bn | Industry |
| Bank of America Corporation | 26 | 435 | Banking & Lending |
| Compagnie Financière Richemont S.A. | 35 | 141 | Home & Lifestyle Products |
| Aflac Incorporated | 18 | 63 | Insurance & Reinsurance |
| Ventas, Inc. | 25 | 47 | Property & REITs |
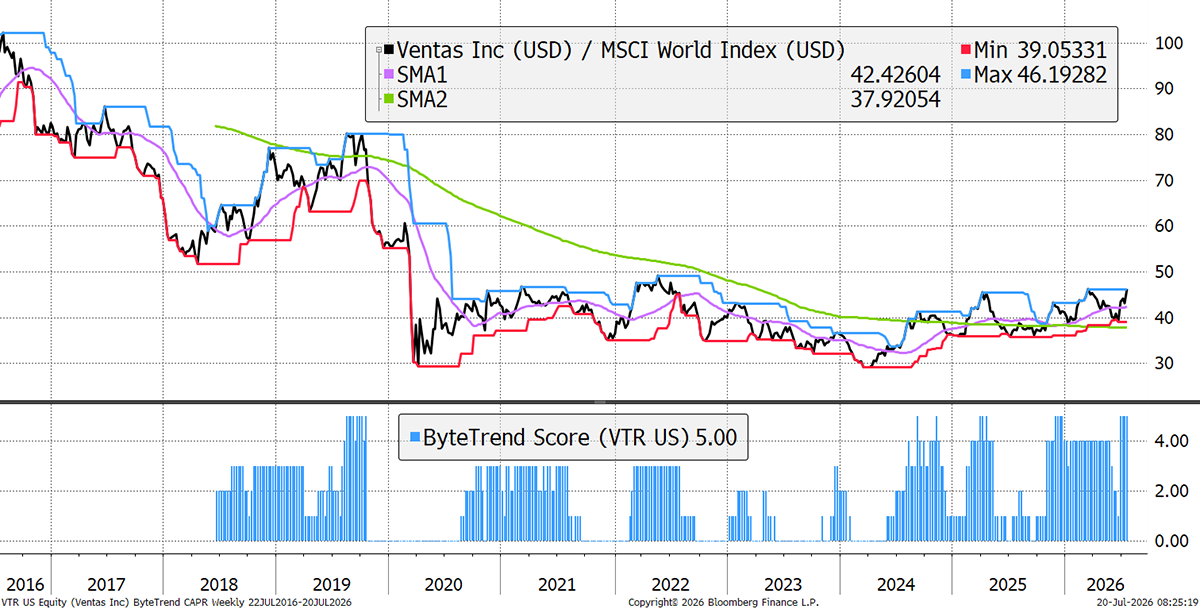
Ventas
Ventas is a US healthcare REIT focused on senior housing and medical/innovation real estate, with around 1,400 properties. It’s the world’s second-largest owner of senior housing, trying to capitalise on the ageing population tailwind. US REIT’s are strengthening more broadly, Healthcare is also showing strength, and Ventas is enjoying high occupancy levels, pricing strength, and double-digit net operating income growth.
Emerging Trends
These stocks are trading at the 30-week CAPR highs with a ByteTrend Score of less than 5. They don’t have to be in an uptrend, just emerging. All charts shown are CAPR rebased to 100.
| Name | Annual Vol 30w | Mkt Cap $Bn | Industry |
| Union Pacific Corporation | 23 | 179 | Transport & Logistics |
| Prologis, Inc. | 21 | 140 | Property & REITs |
| CVS Health Corp. | 33 | 137 | Healthcare & Life Sciences |
| U.S. Bancorp | 24 | 98 | Banking & Lending |
| CSX Corporation | 21 | 94 | Transport & Logistics |
| Snowflake Inc. | 84 | 93 | Technology Software & Services |
| Canadian Pacific Kansas City | 21 | 83 | Transport & Logistics |
| Canadian National Railway | 24 | 78 | Transport & Logistics |
| Norfolk Southern Corporation | 20 | 76 | Transport & Logistics |
| Macquarie Group Limited | 22 | 69 | Banking & Lending |
| Dominion Energy, Inc. | 23 | 62 | Utilities & Clean Energy |
| MetLife, Inc. | 25 | 60 | Insurance & Reinsurance |
| Fomento Económico Mexicano | 19 | 53 | Food & Beverage Producers |
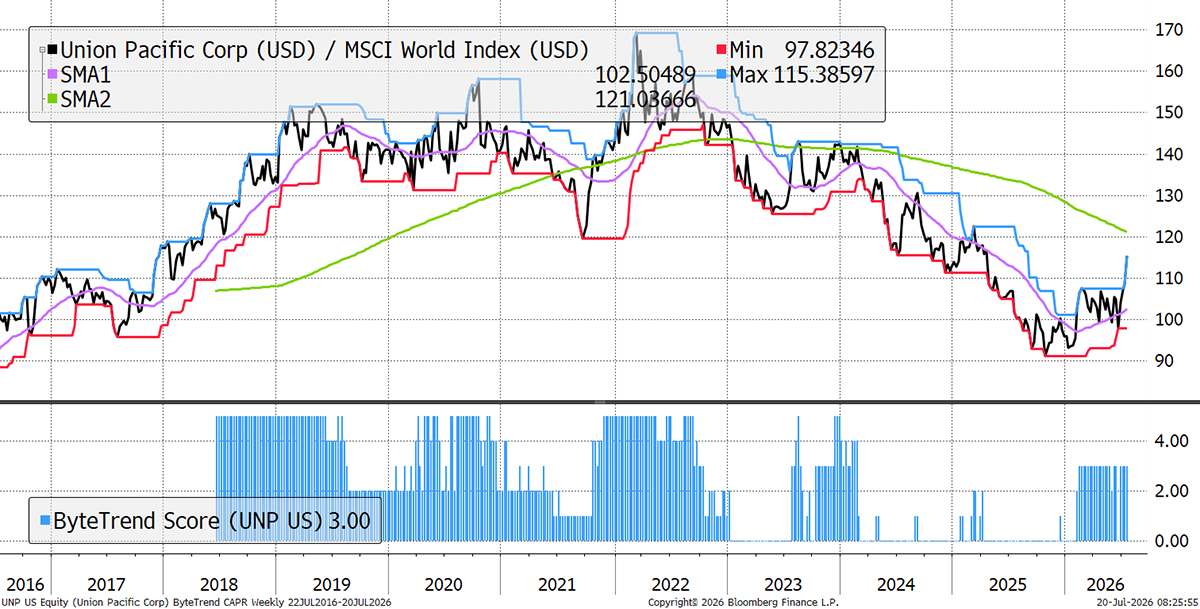
Union Pacific Corp
As one of North America’s great railroad networks and the largest, Union Pacific operates around 33,000 miles of rail across 23 states in the western and southern halves of the country. Favoured for their lack of competition (they can pass on higher fuel costs to customers), railroads have collectively reached record valuation levels, even while underperforming the index. Now, after a multi-year consolidation, surveyed US consumer sentiment is bouncing back, helping to drive the recent surge.
Weakening
These stocks are trading at the 30-week CAPR lows with a ByteTrend Score above 0. They are weakening trends but not yet downtrends. All charts shown are CAPR rebased to 100.
| Name | Annual Vol 30w | Mkt Cap $Bn | Industry |
| Oracle Corporation | 68 | 364 | Software & Services |
| Netflix, Inc. | 40 | 290 | Media & Entertainment |
| International Business Machines | 61 | 200 | Software & Services |
| China Life Insurance Company | 41 | 155 | Insurance & Reinsurance |
| Newmont Corporation | 49 | 96 | Metals & Mining |
| Chugai Pharmaceutical. | 30 | 74 | Healthcare & Life Sciences |
| Agnico Eagle Mines Limited | 54 | 68 | Metals & Mining |
| Barrick Gold Corporation | 46 | 58 | Metals & Mining |
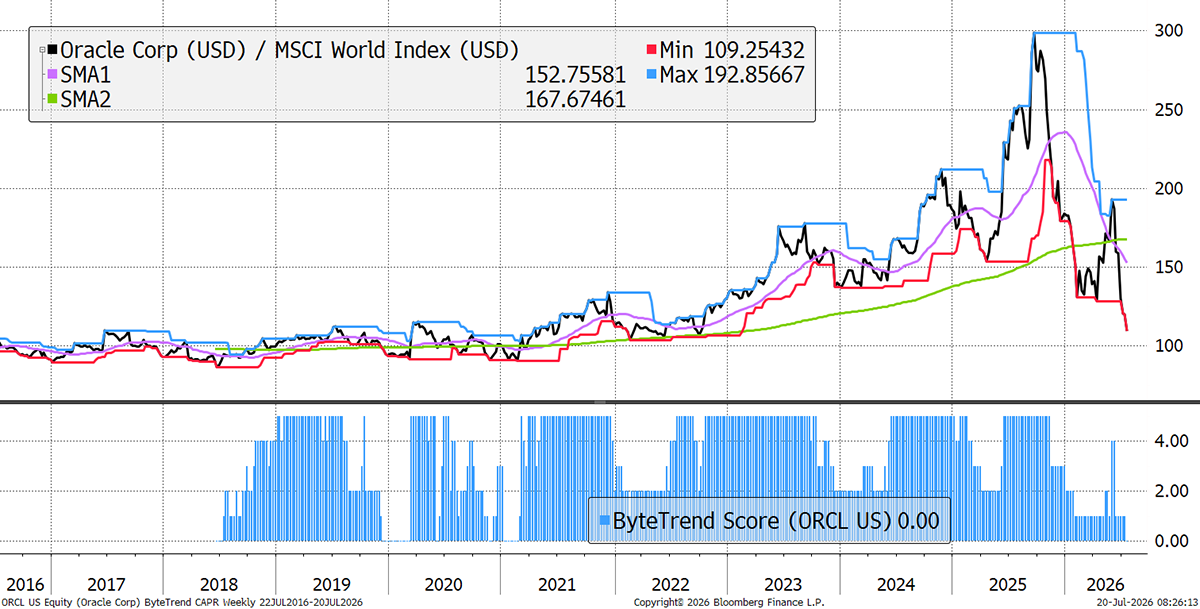
Oracle
Oracle used to make loads of money while having low capex. In 2020, cash flow was around $15bn and capex $1.5bn. Today, revenues have doubled, but capex is headed to peak next year at $103bn. Oracle has bought into the idea that compute = revenue. The market thinks that is wrong.
IBM
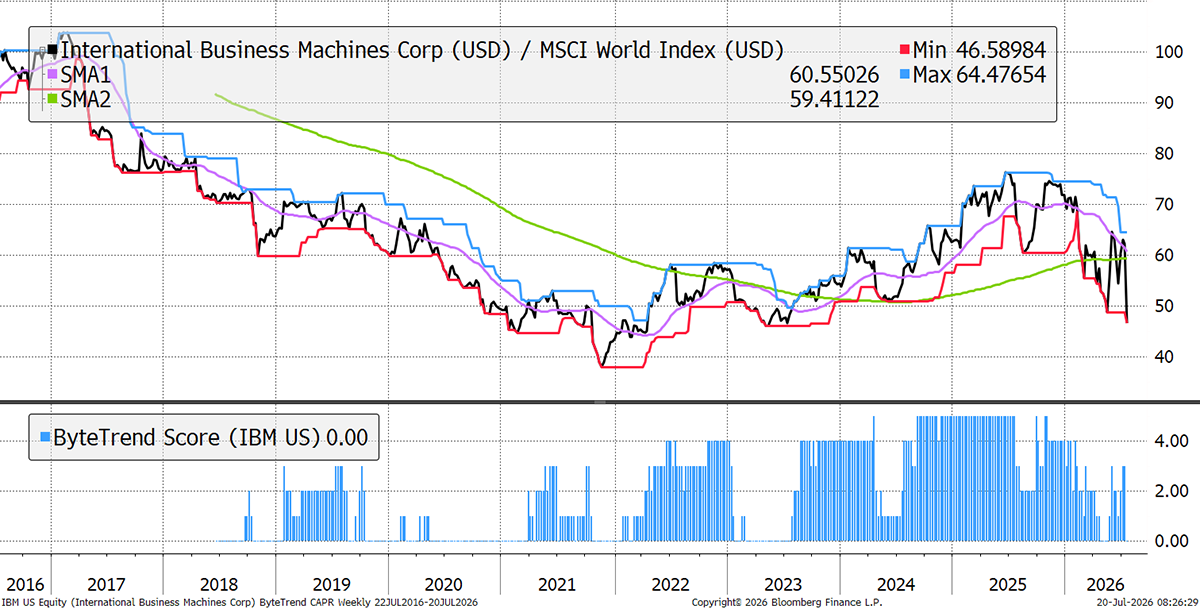
The stock fell 26% last week in a well-publicised fall. Revenue has grown by 1%, which is not enough for a fancy rating. A simpler way to look at IBM is that its FCF yield fell to 4% during the recent tech bubble. Given that the 20-year average has been 8.3%, the recent fall puts the yield back up to 6.5%. IBM is halfway there.
Bear Trends
These stocks are trading at the 30-week CAPR lows with a ByteTrend Score of 0. They are in a downtrend. All charts shown are CAPR rebased to 100.
| Name | Annual Vol 30w | Mkt Cap $Bn | Industry |
| AstraZeneca PLC | 30 | 263 | Healthcare & Life Sciences |
| McDonald's Corporation | 18 | 190 | Food & Beverage Producers |
| The Boeing Company | 34 | 169 | Advanced Industrial Systems |
| Intuitive Surgical, Inc. | 31 | 122 | Healthcare & Life Sciences |
| Lockheed Martin Corporation | 33 | 117 | Advanced Industrial Systems |
| Lowe's Companies, Inc. | 28 | 117 | Home & Lifestyle Products |
| Al Rajhi Banking | 13 | 103 | Banking & Lending |
| EssilorLuxottica S.A. | 30 | 88 | Healthcare & Life Sciences |
| HCA Healthcare, Inc. | 30 | 82 | Healthcare & Life Sciences |
| Synopsys, Inc. | 45 | 74 | Technology Software & Services |
| Boston Scientific | 42 | 65 | Healthcare & Life Sciences |
| Saudi Arabian Mining | 35 | 58 | Construction & Engineering |
| Saudi Telecom Co. | 10 | 57 | Telecom & Network Providers |
| Larsen & Toubro | 32 | 55 | Construction & Engineering |
| L3Harris Technologies | 26 | 53 | Advanced Industrial Systems |
| Hindustan Unilever | 18 | 52 | Home & Lifestyle Products |
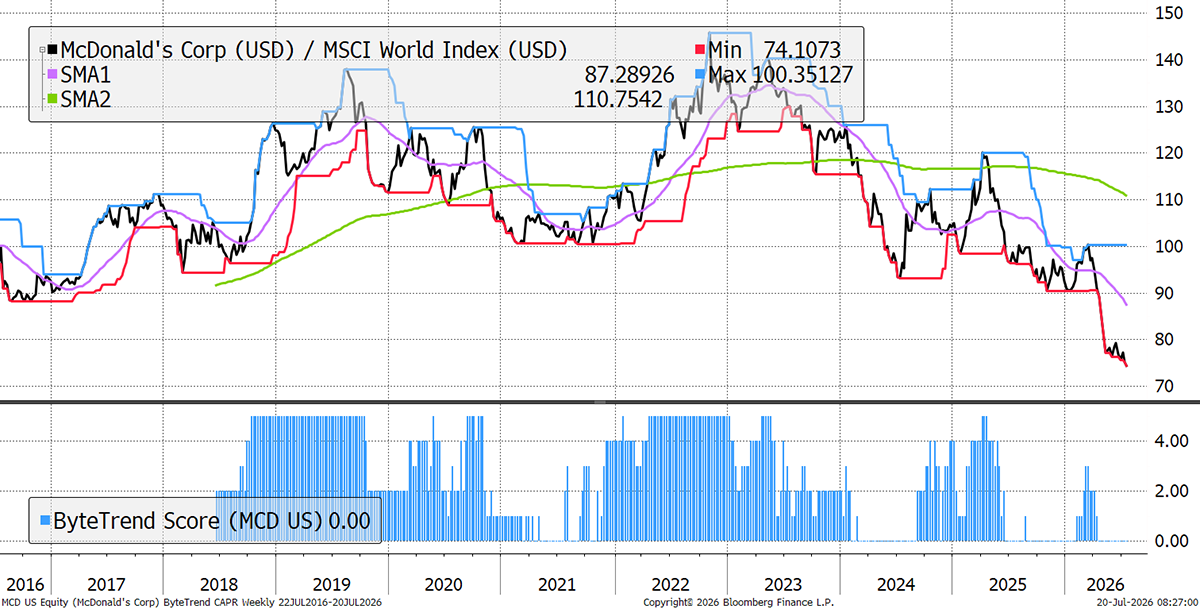
McDonald’s
McDonald’s used to be the barometer of the lower-end consumer, but that is no longer the case as they are trading down, which has slowed growth. High beef prices have hurt margins while investors have dumped consumer defensives, such as fast food, for chips (semis).
Intuitive Surgical
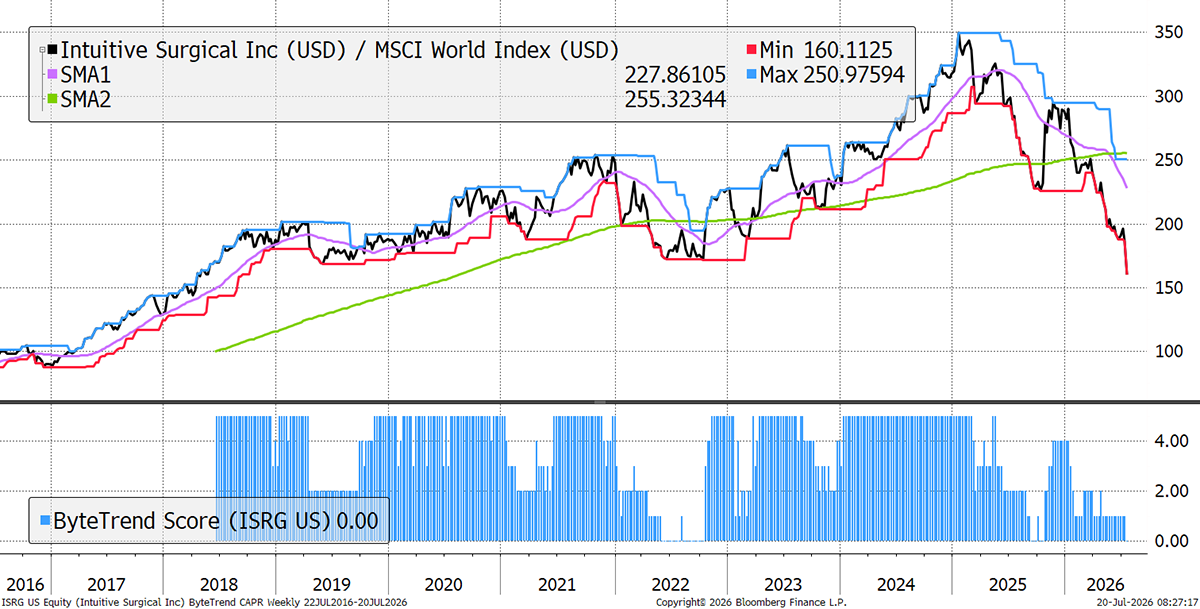
Surgical robots are growing, and this is a great company, but the price had become extreme. Just 18 months ago, the stock traded at 25x sales. Today, it trades at 11x, which is still high, given an FCF yield of just 2%. You can blame the AI bubble to an extent, but even the best companies in the world need realistic expectations for price and growth. We can look forward to adding this to ByteTree Quality when the fall is complete.
GTI 200 Spreadsheet
We are pleased to share the GTI 200 spreadsheet. Download the spreadsheet below to view the CAPR and local currency scores, and more, for the world’s largest 200 stocks. Have a look at the different groups and the main list “All stocks”. The Insights tab is interesting, and don’t forget to expand the columns by clicking on the “+” at the top of the page if you want to see more trend data.
Outlook
The Jaws are crunching, and few investors understand what is happening. If the prevailing trends start to lose, the lost alpha must be shared among the rest of the market. REITs, healthcare, banks, and oil refiners are early winners. When the Jaws come, the bite can intensify as time drags on.
Thanks for reading GTI.


