


Rates Surge


Issue 75;
- Financials take the lead as yields rise.
- Insurance companies are in the sweet spot.
- The jaws keep closing.
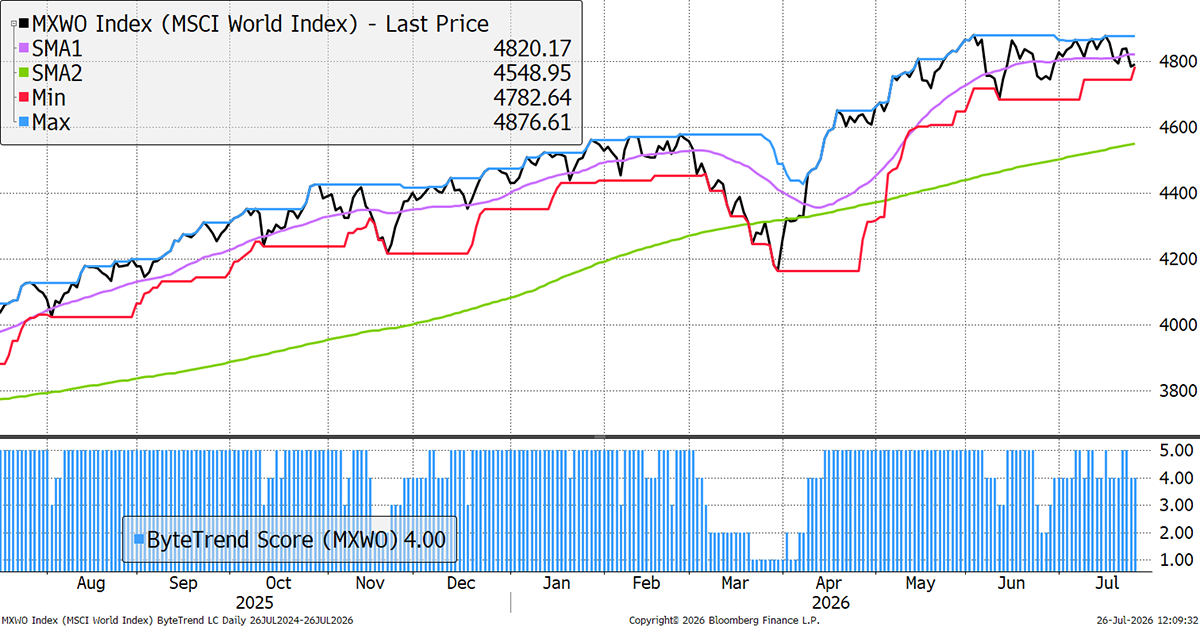
The World Index maintains a ByteTrend Score of 4 in USD. If the price touches the red 30-day min line, that makes it a 3.
World Index – Developed Markets – Daily
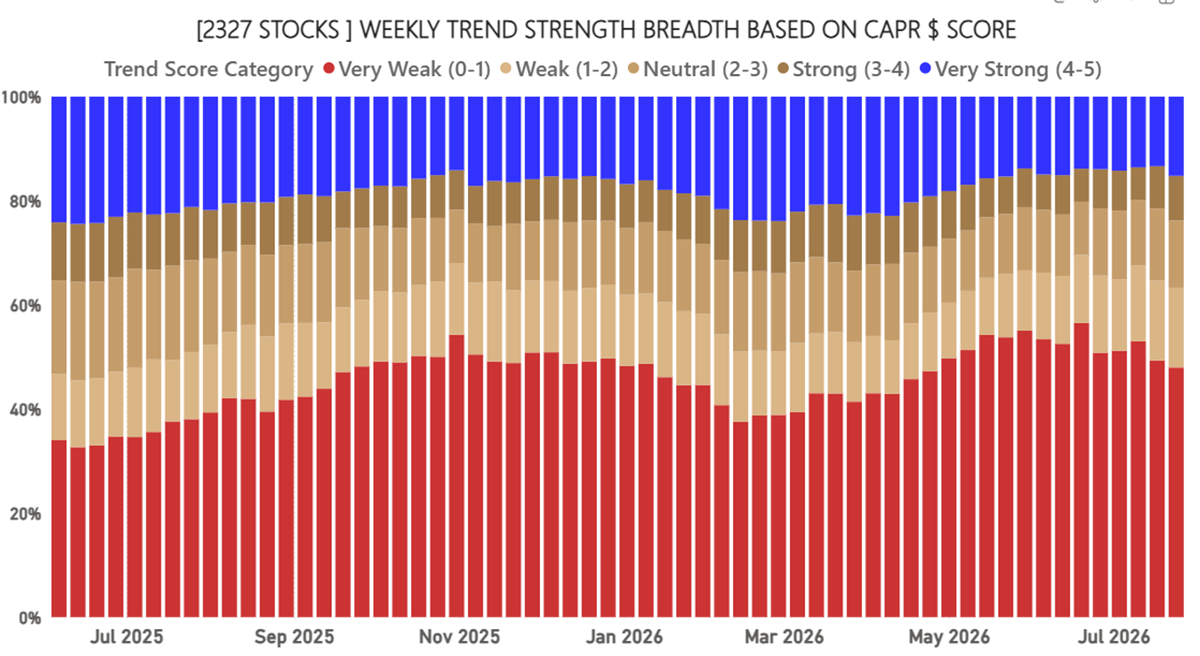
Global Breadth – CAPR
Breadth has expanded as new entrants from banking and insurance have picked up. This is the first expansion since April.
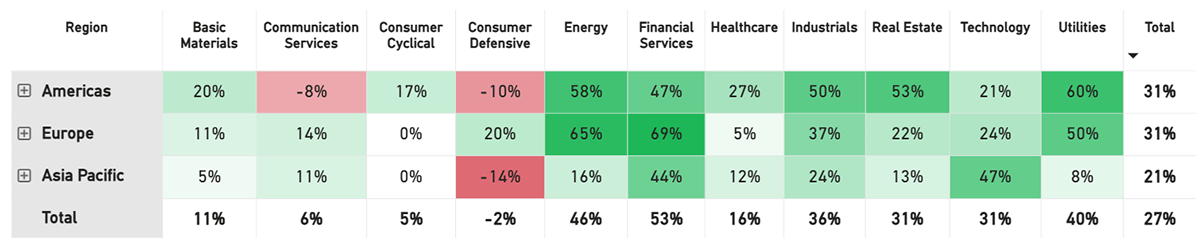
Net Winners
The winners-less-losers metric guides asset allocators. Energy is strong, alongside Utilities. Real Estate is the newcomer, while Financials now dominate.
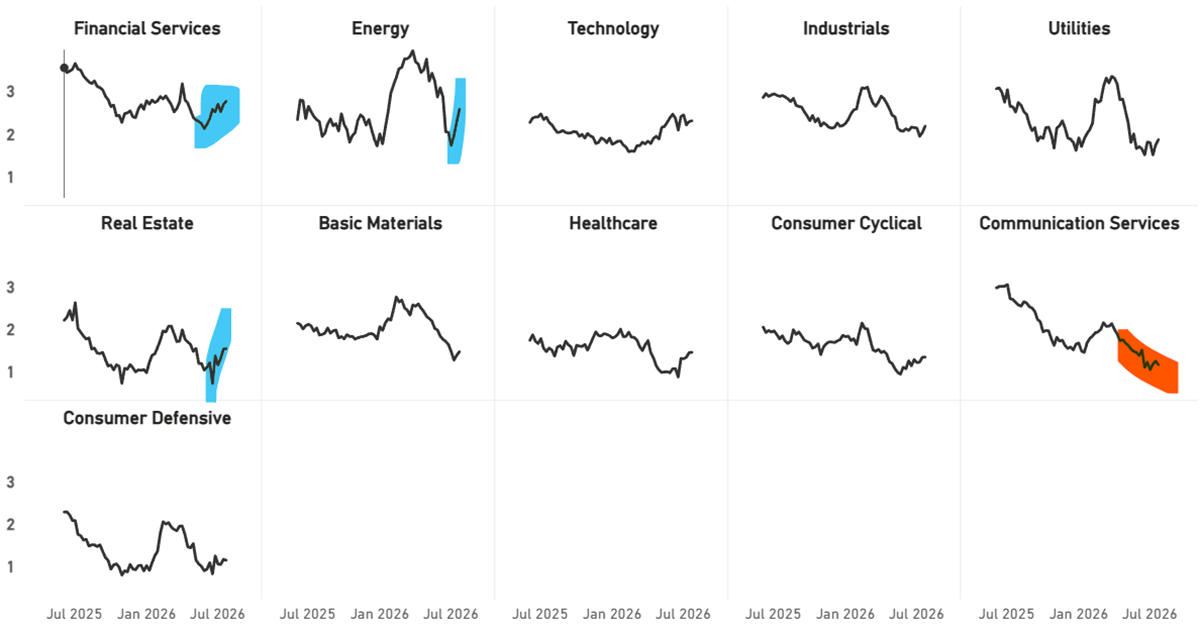
Sector Average Trend Score - CAPR
The recoveries in Energy, Finance and Real Estate are notable. Energy is political again as the war runs in a stop-go cycle. Finance has been strong for some time, but Insurance is looking strong compared to banks. Real Estate is finally out of the doldrums despite rising bond yields. Communications, which includes internet stocks, remains weak.
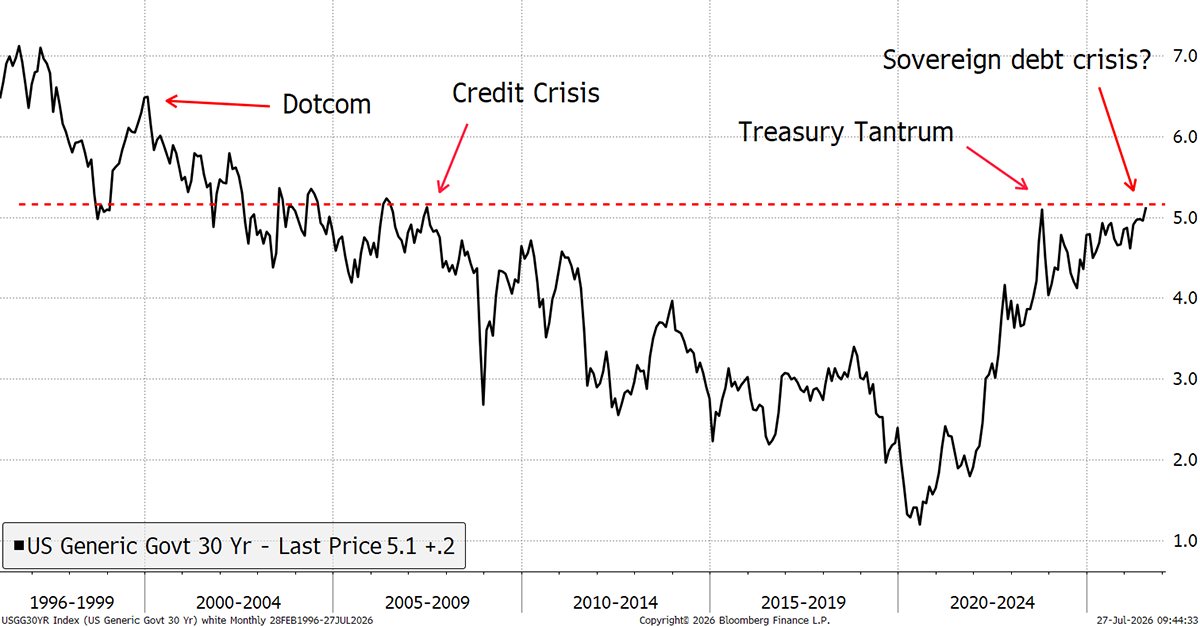
US 30-Year Treasury Yield.
The long bond is reaching for the skies, which is driving the strength in financials. There is only so much the economy can take, and a material rise from here will put downward pressure on the economy.
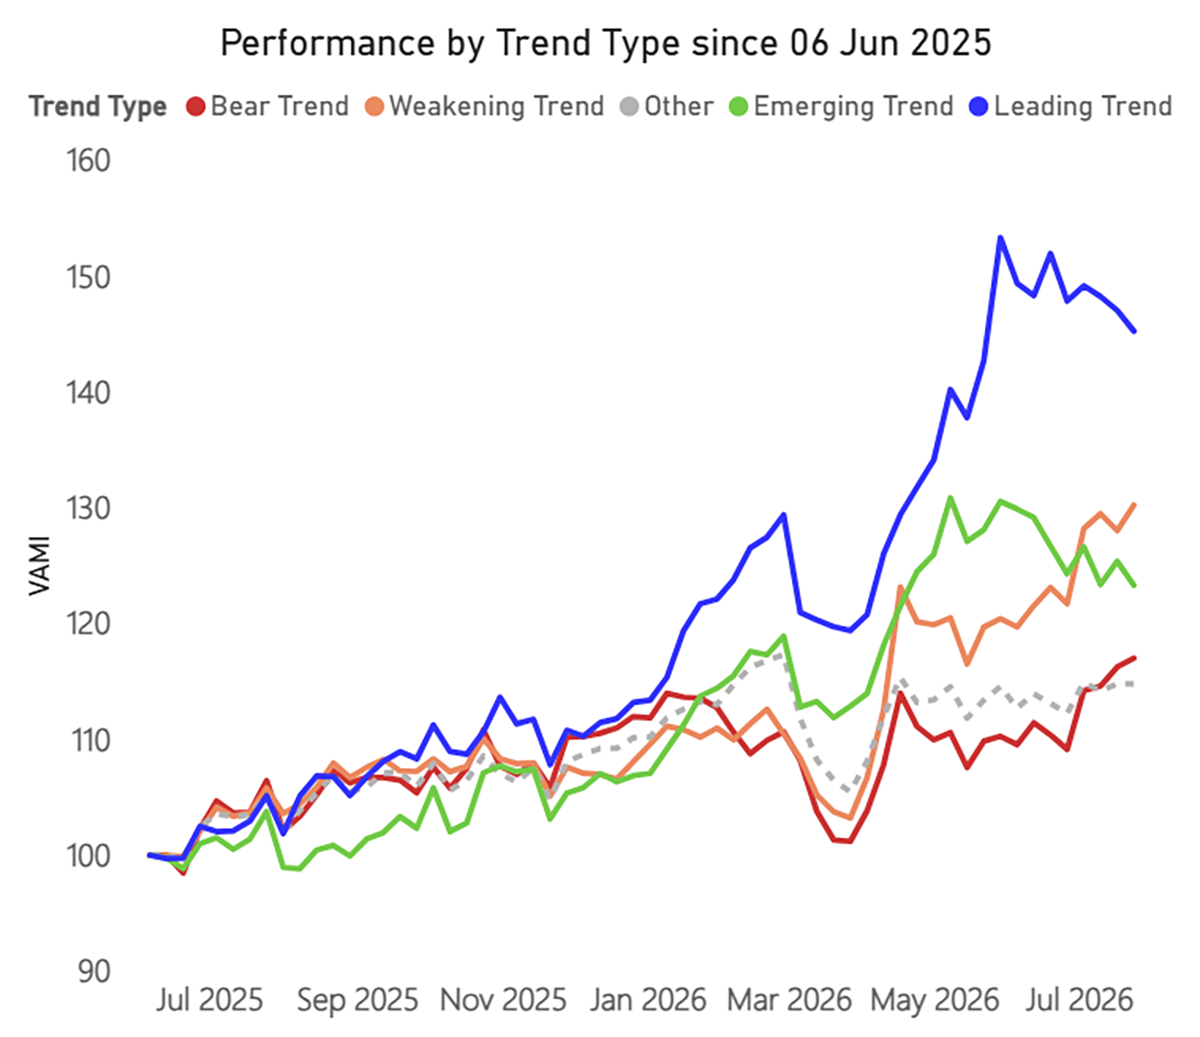
Trend Type Performance
The divergence, or “jaws”, continues. The leaders are lagging the losers, with the best group being weakening trades since May. This is normal in a rotation. To be clear, this week’s weakening trends are typically 30% to 40% below their relative highs in recent months. That can start to look deeply oversold.
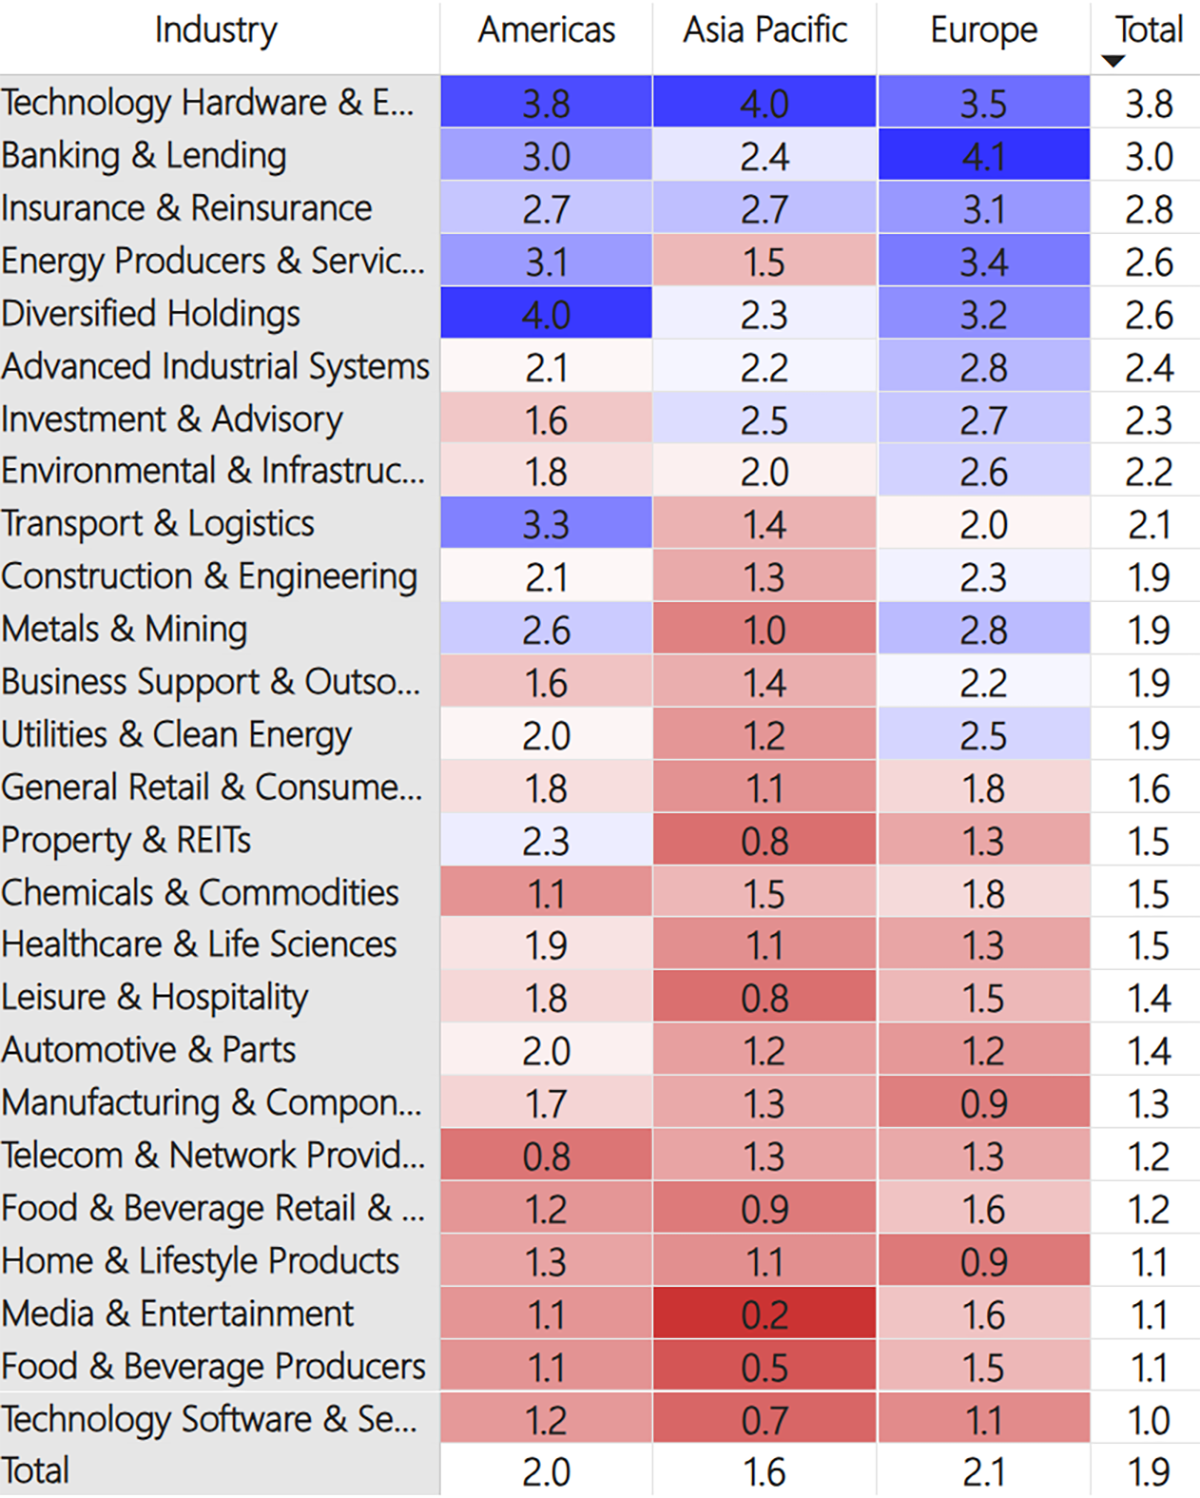
Regions and Industries Average Relative Score
This table (below) shows the average CAPR score for each global industry, by region and in total.
Most industries, strong and weak, had a positive week.
At the top of the table, Tech Hardware bounced slightly, following a five-week slide. Banking & Lending’s recent strength continued, most notably in Europe, but the American banks kicked off reporting season with very strong results, too. Insurance now has the highest % of stocks as leaders of any industry, and completes the top three here, with equal strength across geographies. Energy has bounced strongly in recent weeks, but given the weekend’s news (or lack of it), that may change again in the coming days.
In the middle of the table, Investment stocks joined other financials on the rise, and Infrastructure, Transport, Construction, Utilities, and even Metals & Mining all strengthened relative to the index. Only General Retail and Leisure stocks slipped.
At the bottom of the table, Software gave back ground, continuing its anti-correlation with Hardware, after a few months of recovery. Food & Beverage was also weak, while Manufacturing, Autos, and Telecoms all picked up.
User Guide
Refer to our GTI: User Guide for an overview of the key concepts and terminology used in this report. These concepts may take a little bit of getting used to, but they are very powerful once you do.
Leading Trends with New Highs
These stocks are trading at the 30-week CAPR highs with a ByteTrend Score of 5. All charts shown are CAPR rebased to 100.
| Name | Annual Vol 30w | Mkt Cap $Bn | Industry |
| Apple Inc. | 28 | 4891 | Technology Hardware & Equipment |
| JPMorgan Chase & Co. | 23 | 946 | Banking & Lending |
| AbbVie Inc. | 32 | 458 | Healthcare & Life Sciences |
| Bank of America Corporation | 26 | 440 | Banking & Lending |
| HSBC Holdings plc | 27 | 355 | Banking & Lending |
| Dell Technologies Inc. | 79 | 290 | Technology Hardware |
| Mitsubishi UFJ Financial Group, Inc. | 31 | 259 | Banking & Lending |
| Allianz SE | 22 | 185 | Insurance & Reinsurance |
| Welltower Inc. | 25 | 178 | Property & REITs |
| Sumitomo Mitsui Financial Group, Inc. | 29 | 167 | Banking & Lending |
| DBS Group Holdings Ltd | 16 | 163 | Banks |
| Banco Bilbao Vizcaya Argentaria, S.A. | 28 | 144 | Banking & Lending |
| BNP Paribas S.A. | 27 | 132 | Banking & Lending |
| CaixaBank, S.A. | 29 | 105 | Banking & Lending |
| AXA S.A. | 24 | 105 | Insurance & Reinsurance |
| Oversea-Chinese Banking Corporation | 18 | 101 | Banking & Lending |
| Barclays PLC | 30 | 94 | Banking & Lending |
| ING Groep N.V. | 27 | 94 | Banking & Lending |
| Midea Group | 26 | 91 | Home & Lifestyle Products |
| The Travelers Companies, Inc. | 24 | 81 | Insurance & Reinsurance |
| Simon Property Group, Inc. | 22 | 75 | Property & REITs |
| Assicurazioni Generali S.p.A. | 23 | 73 | Insurance & Reinsurance |
| Manulife Financial Corporation | 20 | 73 | Insurance & Reinsurance |
| United Rentals, Inc. | 52 | 71 | Transport & Logistics |
| The Allstate Corporation | 25 | 67 | Insurance & Reinsurance |
| Aflac Incorporated | 18 | 64 | Insurance & Reinsurance |
| Standard Chartered PLC | 32 | 62 | Banking & Lending |
| WuXi AppTec Co., Ltd. | 39 | 58 | Healthcare & Life Sciences |
| State Street Corporation | 21 | 51 | Investment & Advisory |
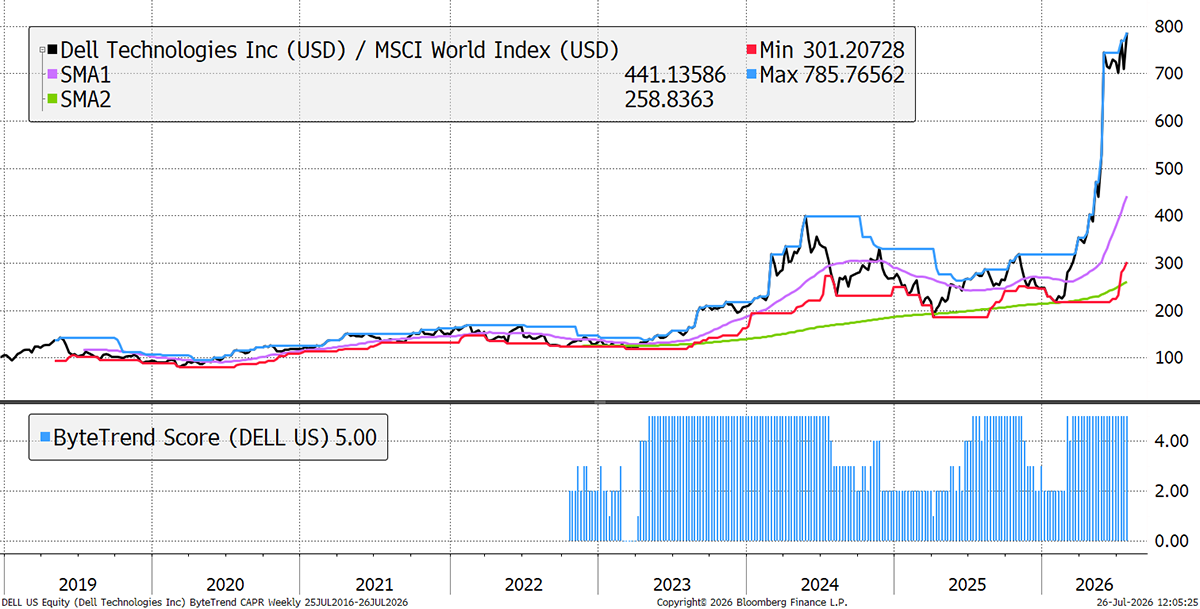
Dell Technologies
Tech Hardware picked up again last week, and Dell was among the winners. Its AI server business is exploding (up 750% YoY) and is now large enough to drive a big step-up in group revenue, earnings, and guidance. This is an AI trade.
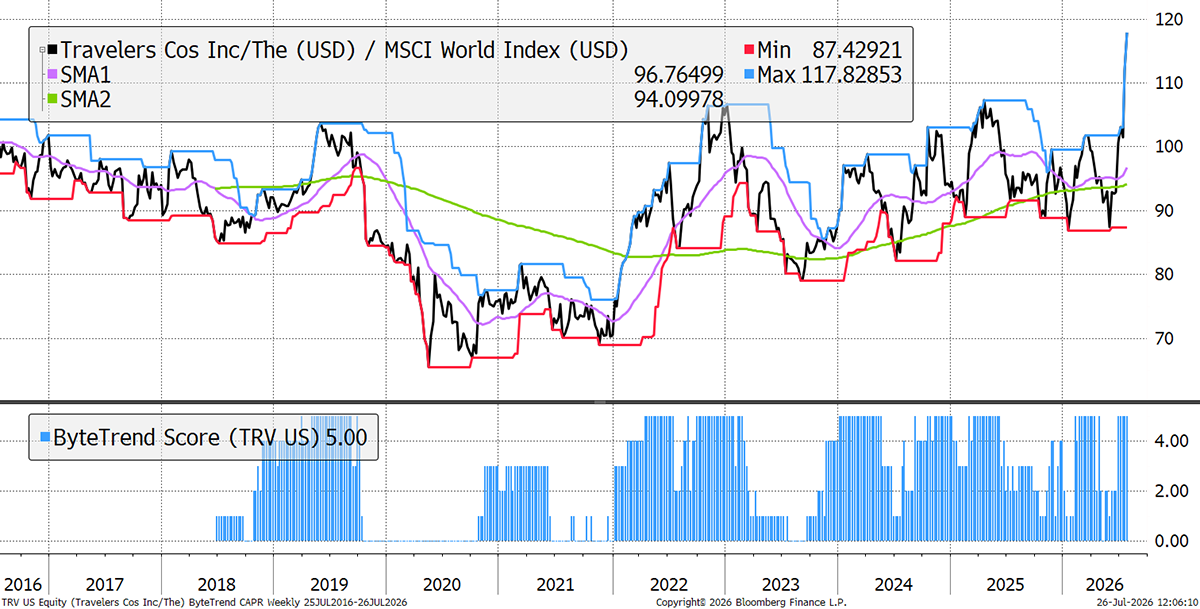
The Travelers Companies
Insurance firm Travelers reported results on July 17 and has shot higher since. It delivered excellent underwriting profitability (combined ratio improved to 83.6%), robust premium growth across segments, and a growing, high-quality investment portfolio driving net investment income up by 14%. Book value per share has risen 16% over the past year.
New Leading Trends
These stocks are trading at the 30-week CAPR highs with a ByteTrend Score of 5, except they are new trends this week, having previously had a score below 5. All charts shown are CAPR rebased to 100.
| Name | Annual Vol 30w | Mkt Cap $Bn | Industry |
| Intesa Sanpaolo S.p.A. | 26 | 129 | Banks |
| Howmet Aerospace Inc. | 35 | 116 | Advanced Industrial Systems |
| Wiwynn Corporation | 70 | 99 | Technology Hardware |
| CSX Corporation | 22 | 99 | Transport & Logistics |
| BOC Hong Kong (Holdings) Limited | 26 | 69 | Banking & Lending |
| Westinghouse Air Brake Technologies | 29 | 51 | Transport & Logistics |
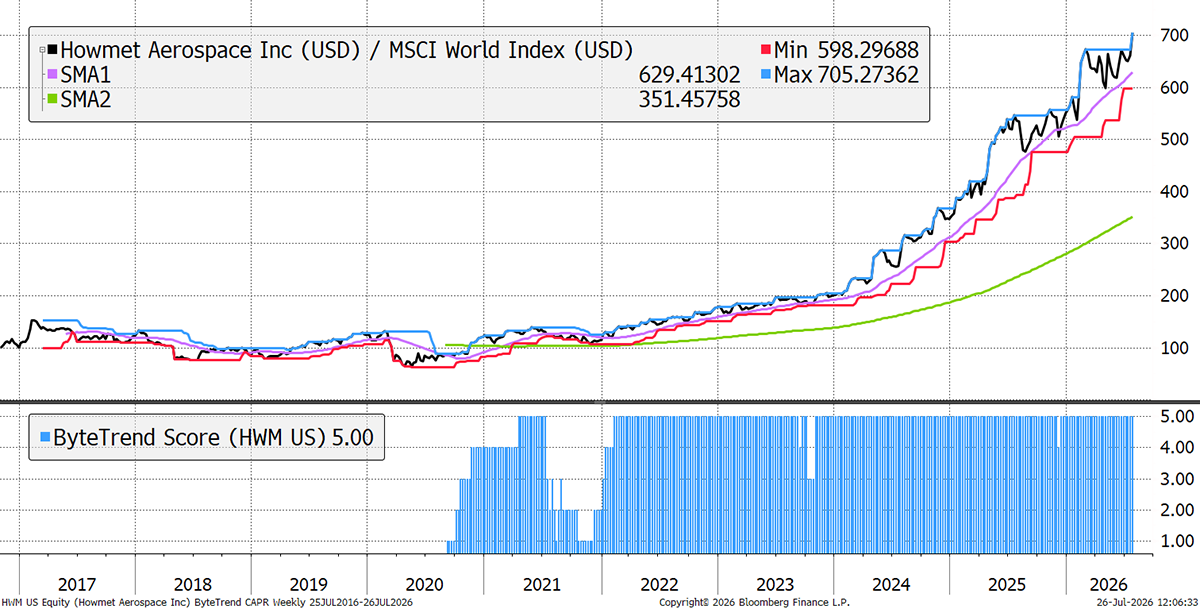
Howmet Aerospace
European aerospace stocks may have given up ground in 2026, as the defence theme cooled, but not US-based Howmet. Its commercial aviation segment has been a strong point, driven by strong aircraft build rates and demand for spare parts. Meanwhile, gas turbines are also a meaningful contributor. Defence is a third factor for the company, not the core. Revenues were up 19% in the most recent results, and EPS +42%.
Emerging Trends
These stocks are trading at the 30-week CAPR highs with a ByteTrend Score of less than 5. They don’t have to be in an uptrend, just emerging. All charts shown are CAPR rebased to 100.
| Name | Annual Vol 30w | Mkt Cap $Bn | Industry |
| Union Pacific Corporation | 23 | 183 | Transport & Logistics |
| CVS Health Corp. | 33 | 137 | Healthcare & Life Sciences |
| U.S. Bancorp | 24 | 100 | Banking & Lending |
| Snowflake Inc. | 84 | 93 | Software & Services |
| Norfolk Southern Corporation | 20 | 79 | Transport & Logistics |
| Canadian National Railway Company | 24 | 79 | Transport & Logistics |
| Dominion Energy, Inc. | 23 | 63 | Utilities & Clean Energy |
| MetLife, Inc. | 25 | 61 | Insurance & Reinsurance |
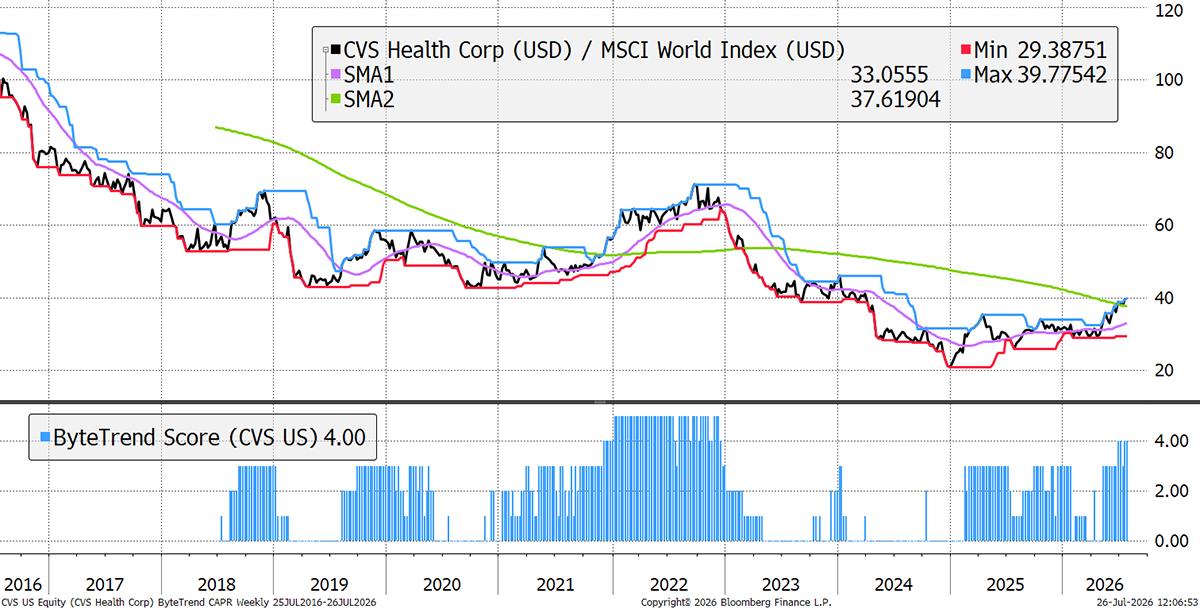
CVS Health
CVS is a US-based health insurance and pharmacy services company. Following an extended period of difficulty, it has been beating expectations, raising guidance, and showing improvement across insurance, retail pharmacy, and health services.
Weakening
These stocks are trading at the 30-week CAPR lows with a ByteTrend Score above 0. They are weakening trends but not yet downtrends. All charts shown are CAPR rebased to 100.
| Name | Annual Vol 30w | Mkt Cap $Bn | Industry |
| Walmart Inc. | 28 | 871 | Food & Beverage Retail |
| Uber Technologies, Inc. | 29 | 134 | Software & Services |
| AppLovin Corporation | 76 | 132 | Software & Services |
| CRH plc | 34 | 67 | Construction & Engineering |
| Carvana Co. | 59 | 66 | Automotive & Parts |
| Warner Bros. Discovery, Inc. | 13 | 65 | Media & Entertainment |
| DSV A/S | 36 | 53 | Transport & Logistics |
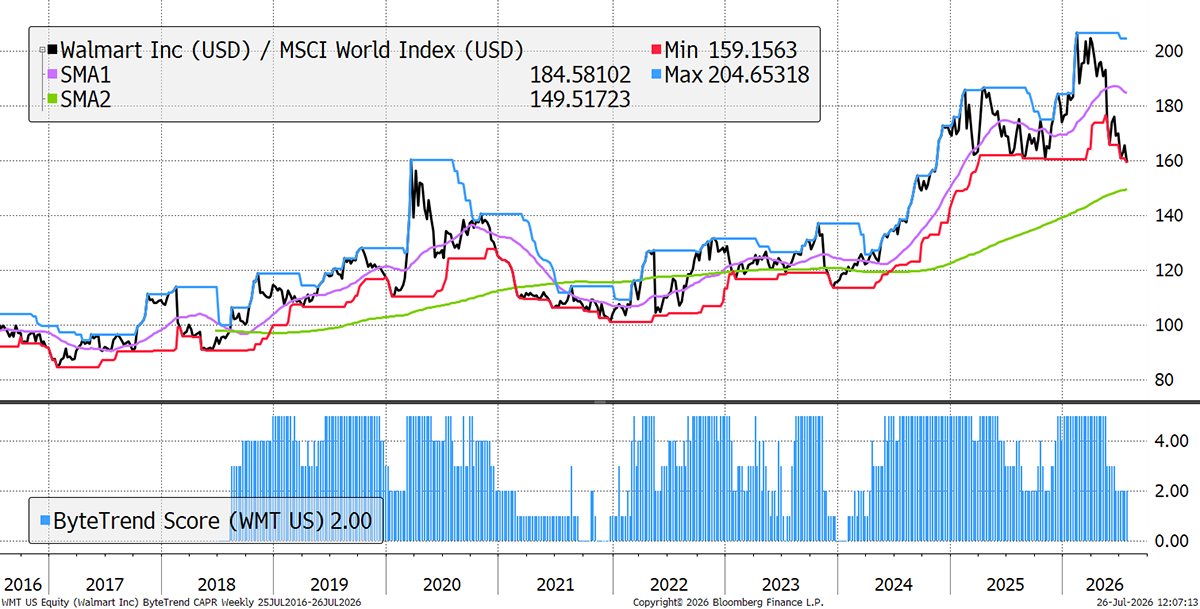
Walmart
Walmart is a great company, but valuation reached extreme levels. Its price/sales ratio reached 1.6x, against a 10-year average of 0.7x, while its FCF yield almost reached 1%, a very low figure. The PE ratio was 50x, for a company growing 5% in a competitive industry with thin margins. Being so product- and logistics-heavy, it is hurt by higher fuel costs and rising product prices, but is investing in advertising and membership programs to offset this.
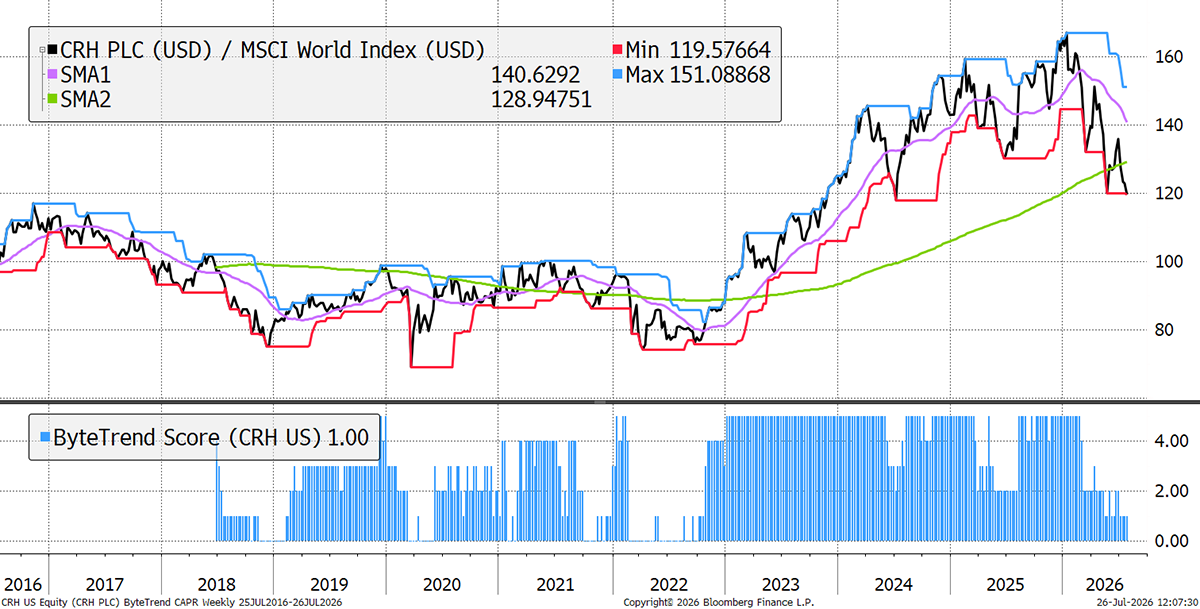
CRH plc
Construction materials giant CRH reached valuation multiples 2x higher than just before the 2008 crash. However, revenue growth is only mid-single-digit, and returns on capital have been falling for two years, as net debt has risen. In late June, seeking to buy into the infrastructure megatrends of data centres and electrification, it acquired Arcosa for $8.5bn in an all-cash deal. Arcosa is a leading US provider of building materials and critical infrastructure products.
Bear Trends
These stocks are trading at the 30-week CAPR lows with a ByteTrend Score of 0. They are in a downtrend. All charts shown are CAPR rebased to 100.
| Name | Annual Vol 30w | Mkt Cap $Bn | Industry |
| Tesla, Inc. | 43 | 1236 | Automotive & Parts |
| Oracle Corporation | 69 | 331 | TSoftware & Services |
| Roche Holding AG | 16 | 314 | Healthcare & Life Sciences |
| AstraZeneca PLC | 30 | 262 | Healthcare & Life Sciences |
| LVMH Moët Hennessy | 30 | 259 | Home & Lifestyle Products |
| McDonald's Corporation | 18 | 188 | Food & Beverage Producers |
| Reliance Industries Limited | 22 | 179 | Energy Producers |
| The Boeing Company | 34 | 165 | Advanced Industrial |
| Intuitive Surgical, Inc. | 31 | 120 | Healthcare & Life Sciences |
| Lowe's Companies, Inc. | 28 | 116 | Home & Lifestyle Products |
| Al Rajhi Banking and Investment | 13 | 102 | Banking & Lending |
| Prosus N.V. | 35 | 89 | Software & Services |
| Christian Dior SE | 29 | 87 | Home & Lifestyle Products |
| EssilorLuxottica S.A. | 30 | 85 | Healthcare & Life Sciences |
| Synopsys, Inc. | 45 | 72 | Software & Services |
| Larsen & Toubro Limited | 32 | 54 | Construction & Engineering |
| HOYA Corporation | 23 | 50 | Healthcare & Life Sciences |
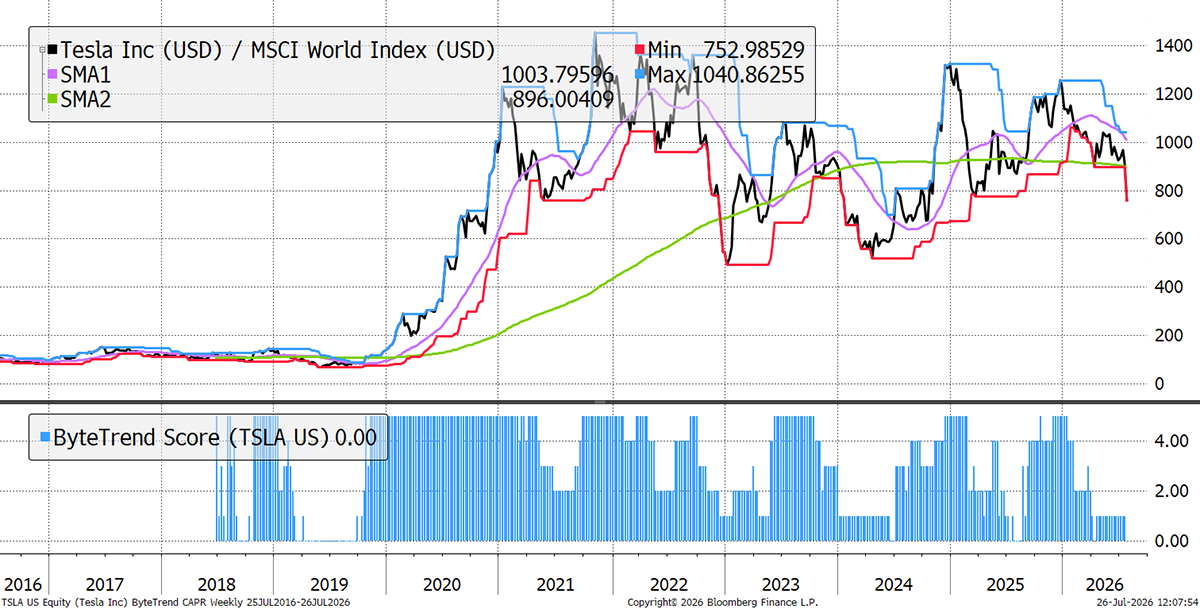
Tesla
If a good trend is when the price is above two rising moving averages, a bearish one is when it is below two falling ones. Tesla has gone from the former to the latter in a heartbeat. Musk continues to make headlines for the wrong reasons. His attention appears to have shifted to X and Space, not cars, and both vehicle sales and carbon credits sold to fellow automakers dried up in recent results. Free cash flow hasn’t grown in four years, but it trades on an FCF yield below 0.5%, making it one of the most expensive large-cap stocks in the world. Its results last week showed falling margins, rising capex, and a negative FCF .
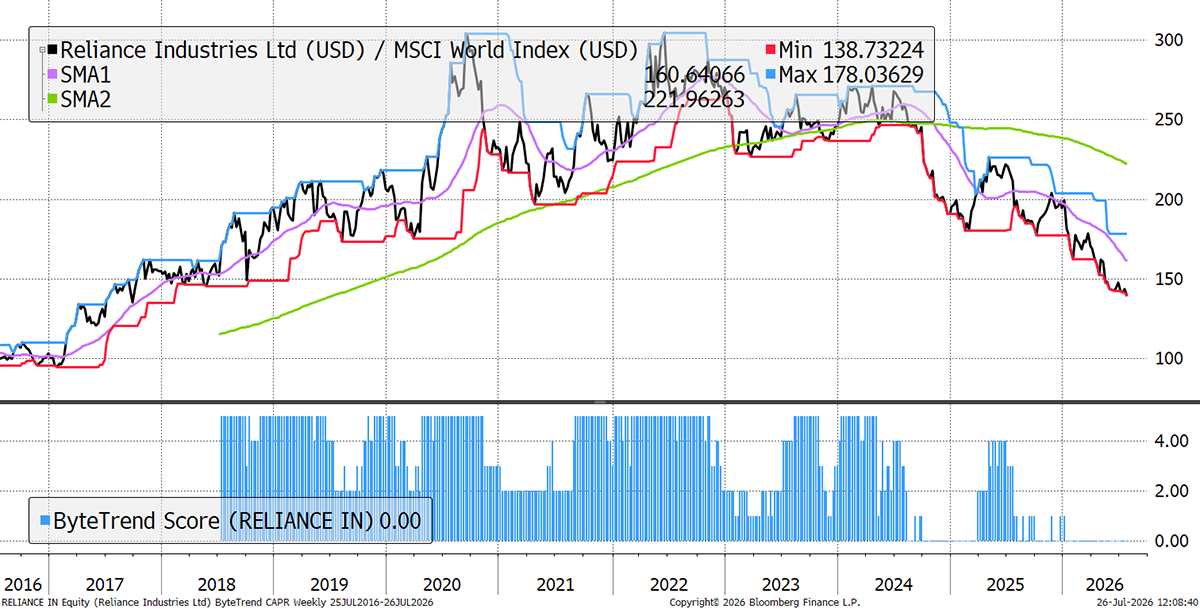
Reliance Industries
Indian weakness continues, partly driven by the Rupee’s weakness (CAPR adjusts for currency). It is a conglomerate, with a core oil-to-chemicals business. However, the investment case is increasingly about the strong 5G and subscriber growth in its telecom division Jio, record revenues in its retail business, and the digital/data-centre buildout. However, a weak Indian stockmarket and margin pressure in its core business are driving the story for now.
GTI 200 Spreadsheet
We are pleased to share the GTI 200 spreadsheet. Download the spreadsheet below to view the CAPR and local currency scores, and more, for the world’s largest 200 stocks. Have a look at the different groups and the main list “All stocks”. The Insights tab is interesting, and don’t forget to expand the columns by clicking on the “+” at the top of the page if you want to see more trend data.
Outlook
The divergence continues, with the leaders lagging, having done so well in recent months. The oversold stocks are making the money while the leadership is expanding. It sounds confusing but quite logical. As the Tech Hardware stocks weaken, something has to take their place. There is no massive new theme, so Financials, Energy, and Real Estate have stepped in.
Thanks for reading GTI.


