


Wafer Thin


Issue 77;
- Market breaks higher on a weaker dollar.
- Utilities nosedive.
- Rotation continues, but the leaders bounce.
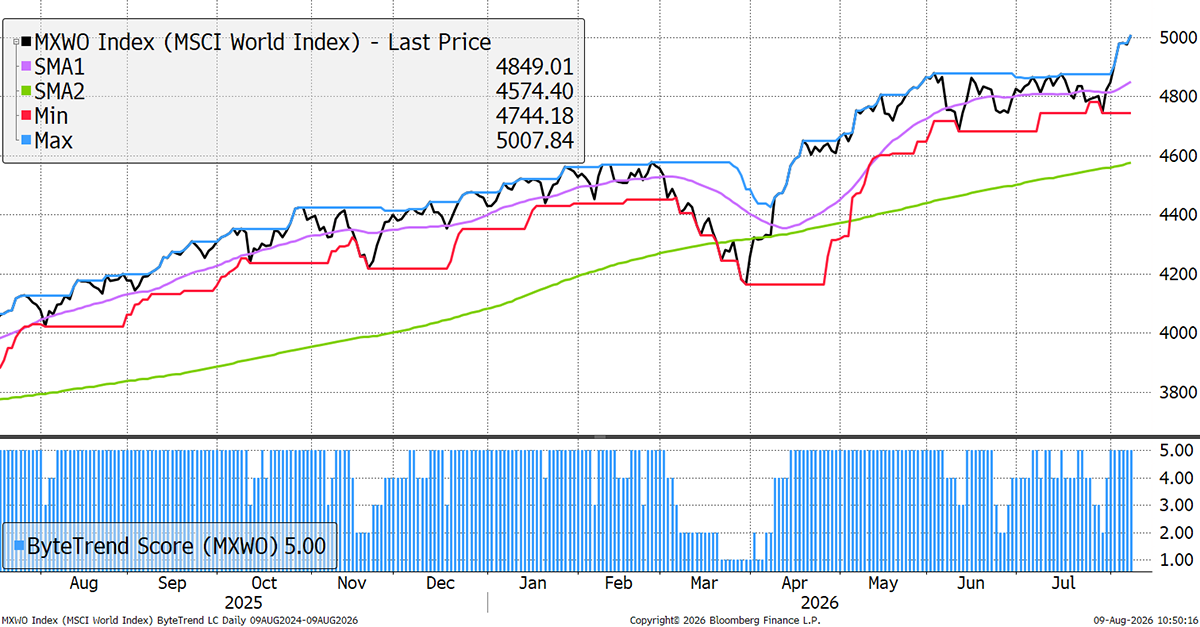
The World Index returns to a ByteTrend Score of 5 in USD and makes a new all-time high. This is a strong move boosted by a drop in the dollar following the yen intervention.
World Index – Developed Markets – Daily
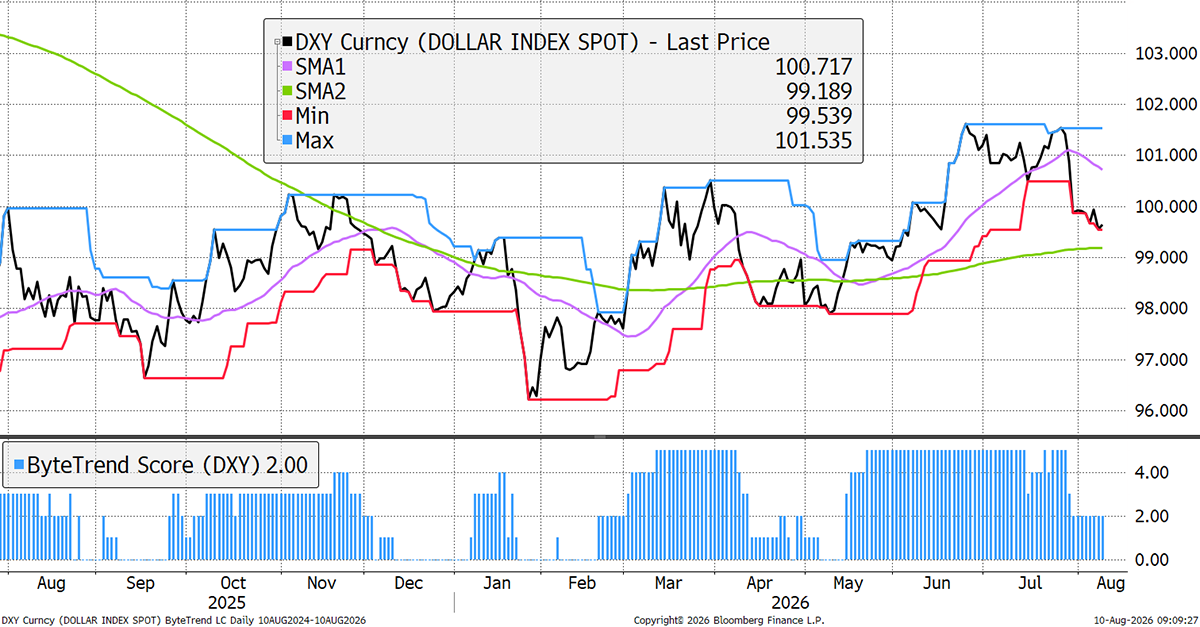
Dollar Index Daily
The dollar fell on US JPY intervention. It is not a huge move but explains the breakout in global equities. The dollar is in a sluggish uptrend. Bessent may like to see the dollar lower.
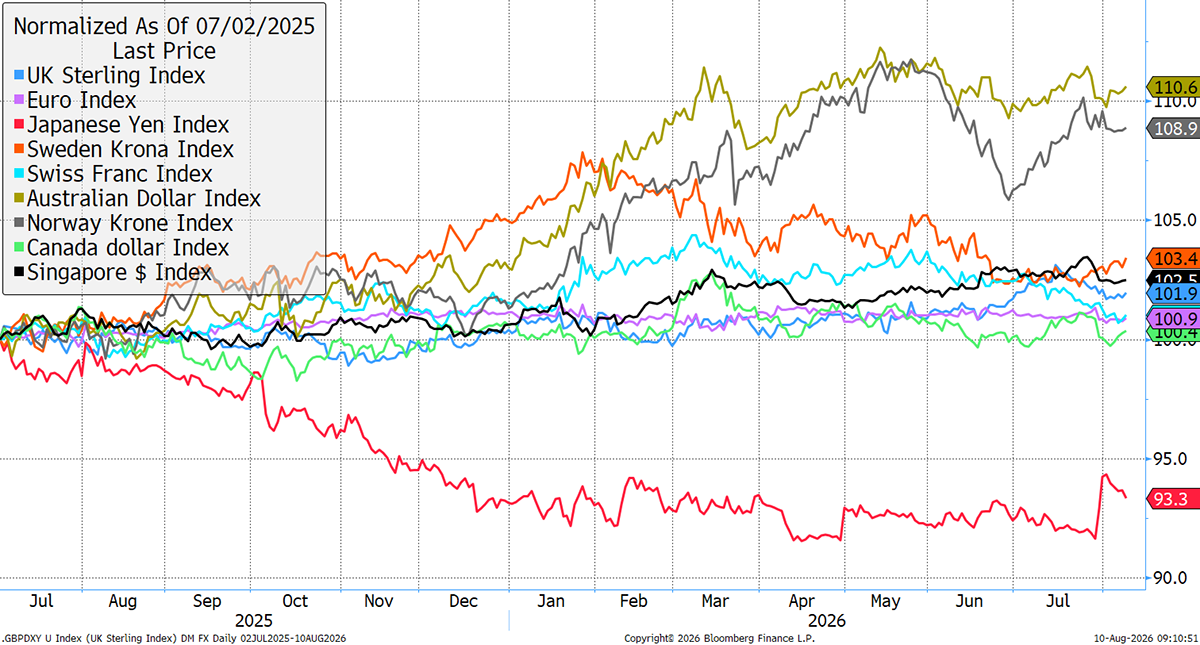
FX Cross Rates
The yen moved higher on the intervention, from low levels. The AUD and NOK are still leaders, while CAD, EUR, GBP, CHF, SEK, and SGD remain in a tight group.
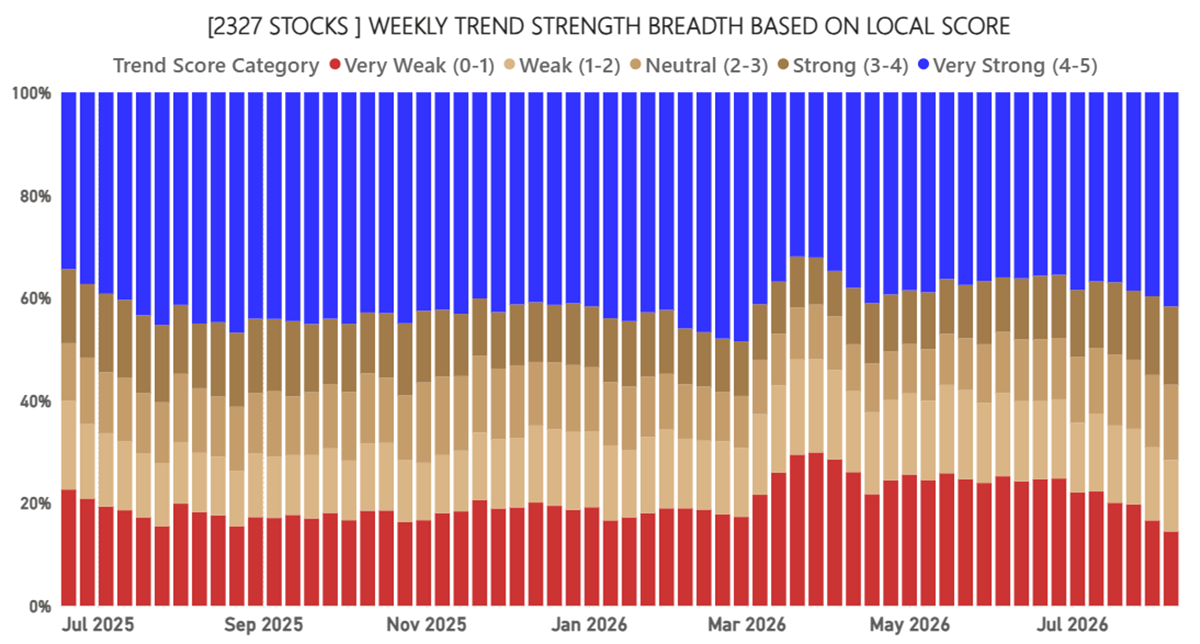
World Breadth in Local Currency
Equities see expanding breadth again; the dollar drop will have helped…
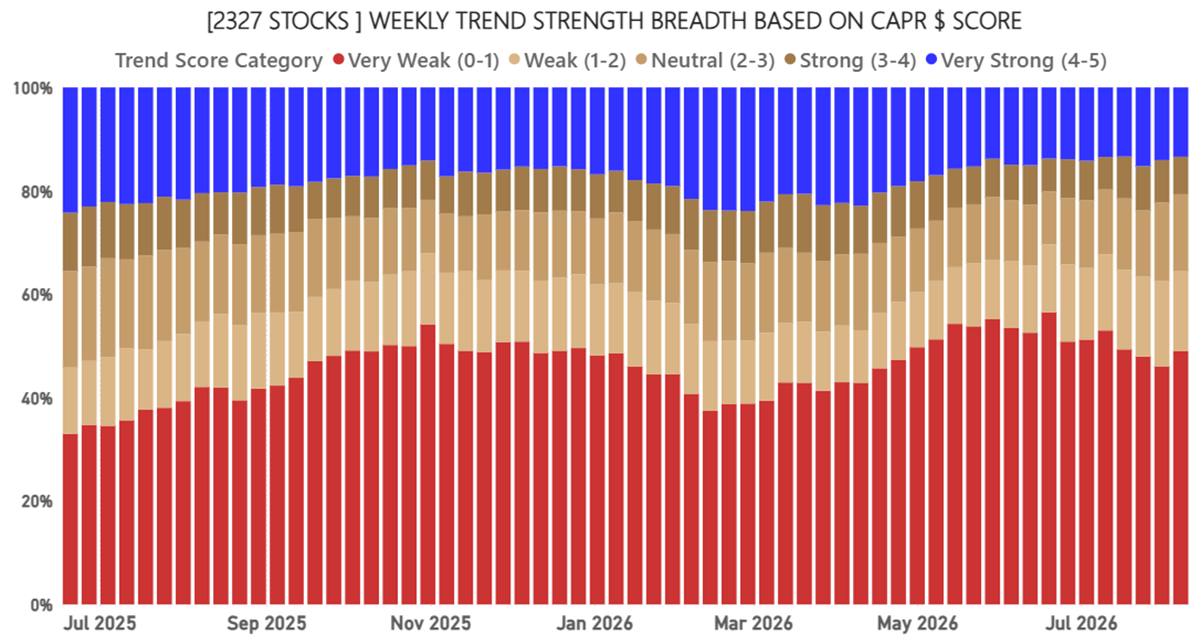
World Breadth in CAPR
…but leadership in CAPR (alpha rather than beta) narrows even further. To paraphrase Monty Python, alpha has become “wafer thin”.
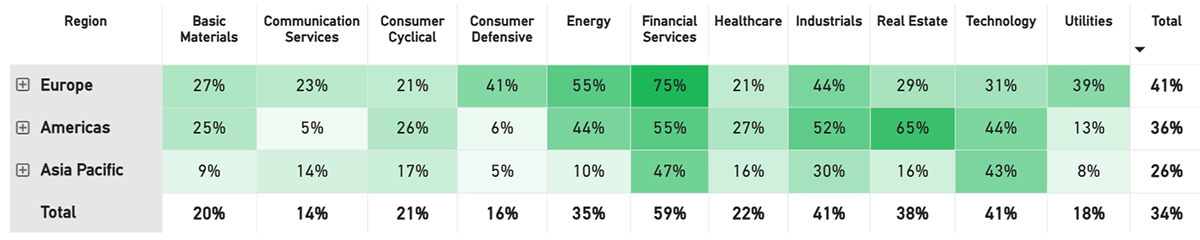
Net Winners
The winners-less-losers metric guides asset allocators. Europe dominates, mainly with financial services, but they are slowing from strong levels. Real estate is now strong, especially in the USA. Utilities have dropped off, and tech continues to see software win over hardware. The consumer is firmer but still slight in the leadership.
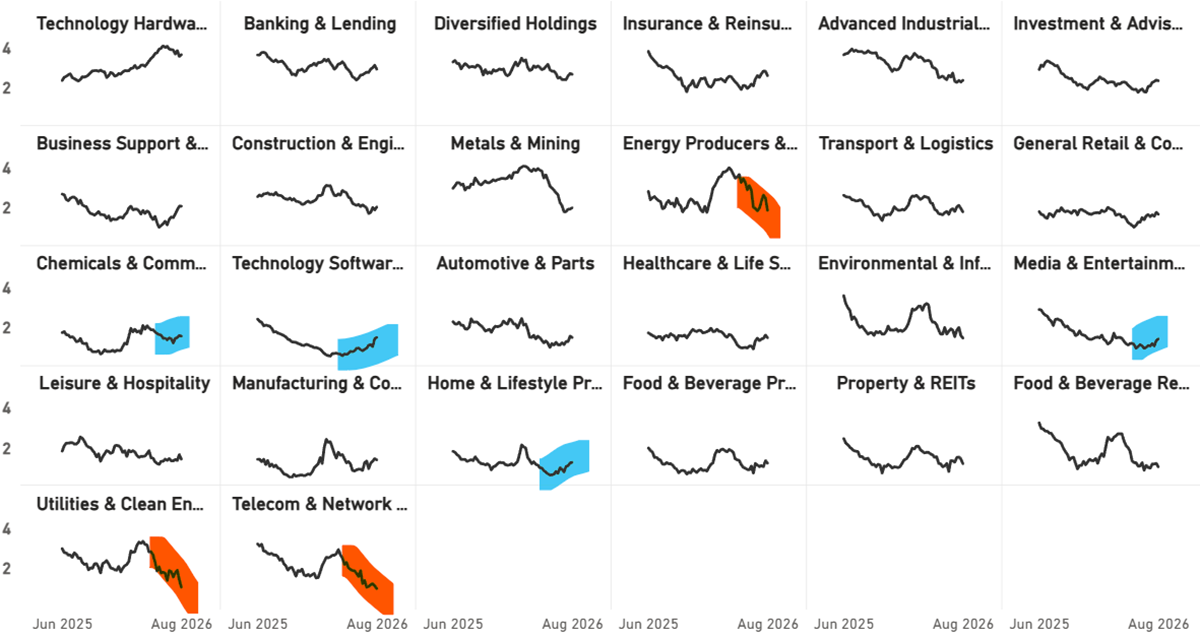
Industry Groups Average CAPR Score
The firming industries include software, chemicals, media and home & lifestyle. Energy continues to roll over. The surprise slump comes from utilities. Telecoms remain the weakest group.
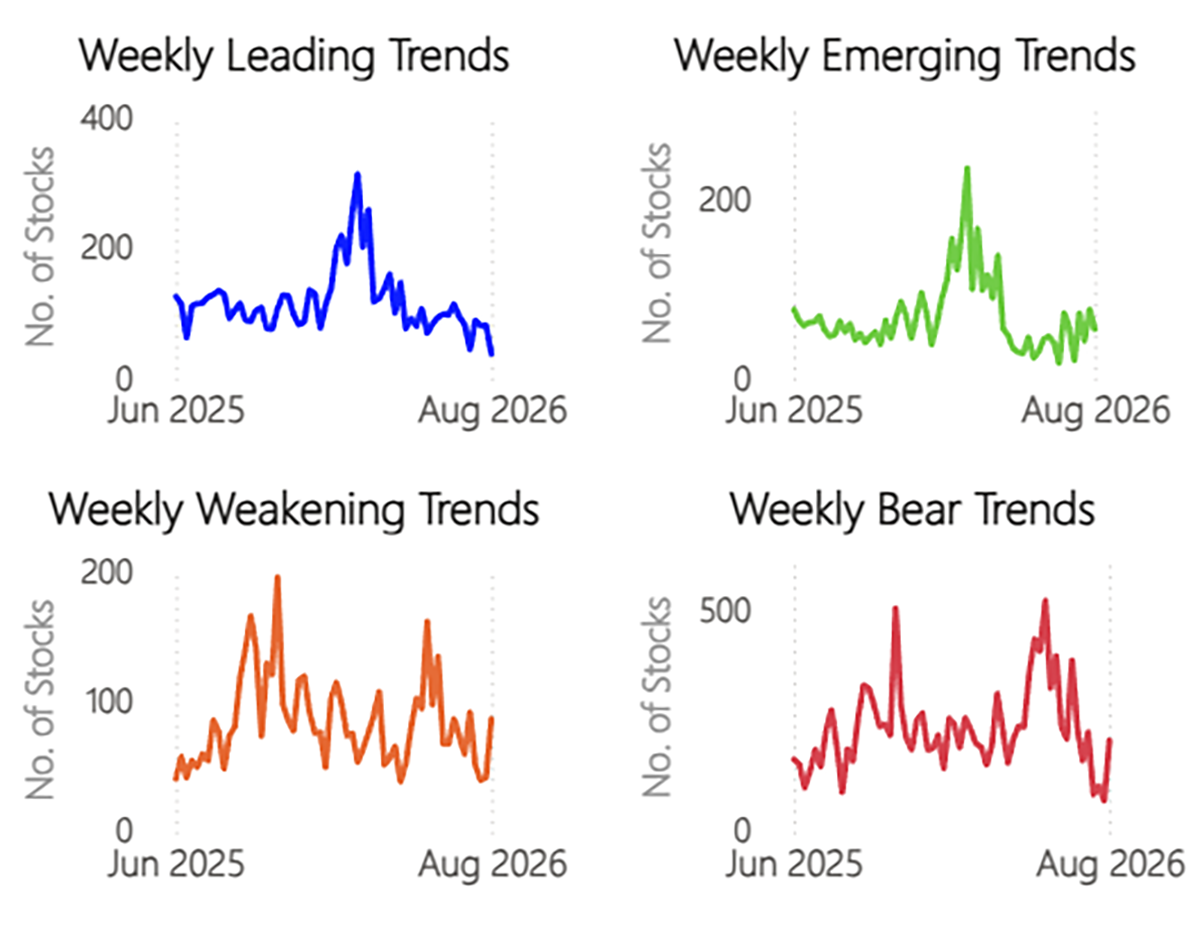
Trend Type Performance – Number of Trends
Fewer leading trends, and not too many emerging trends. Weakening and bear trends are back on the rise in CAPR terms. This reflects the narrowing leadership.
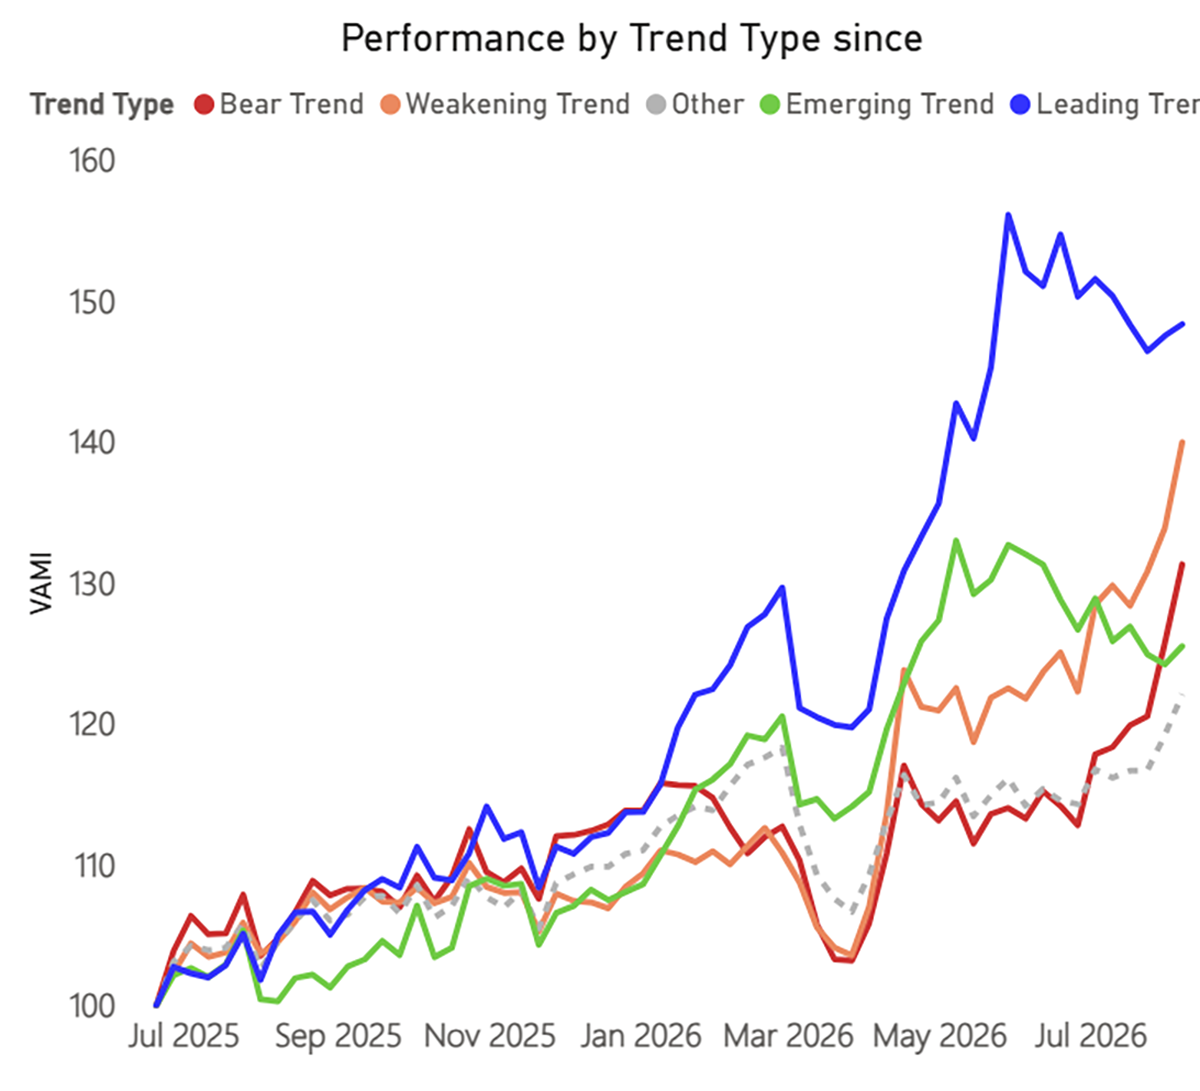
Trend Type Performance
The divergence continues to narrow, although the leaders and the emerging trends had an upsweep for the first time since late May. The bear and weakening trends are driving market returns. That means oversold stocks are not falling; they are bouncing. The rotation is strongest in the Americas.
Regions and Industries Average Relative Score
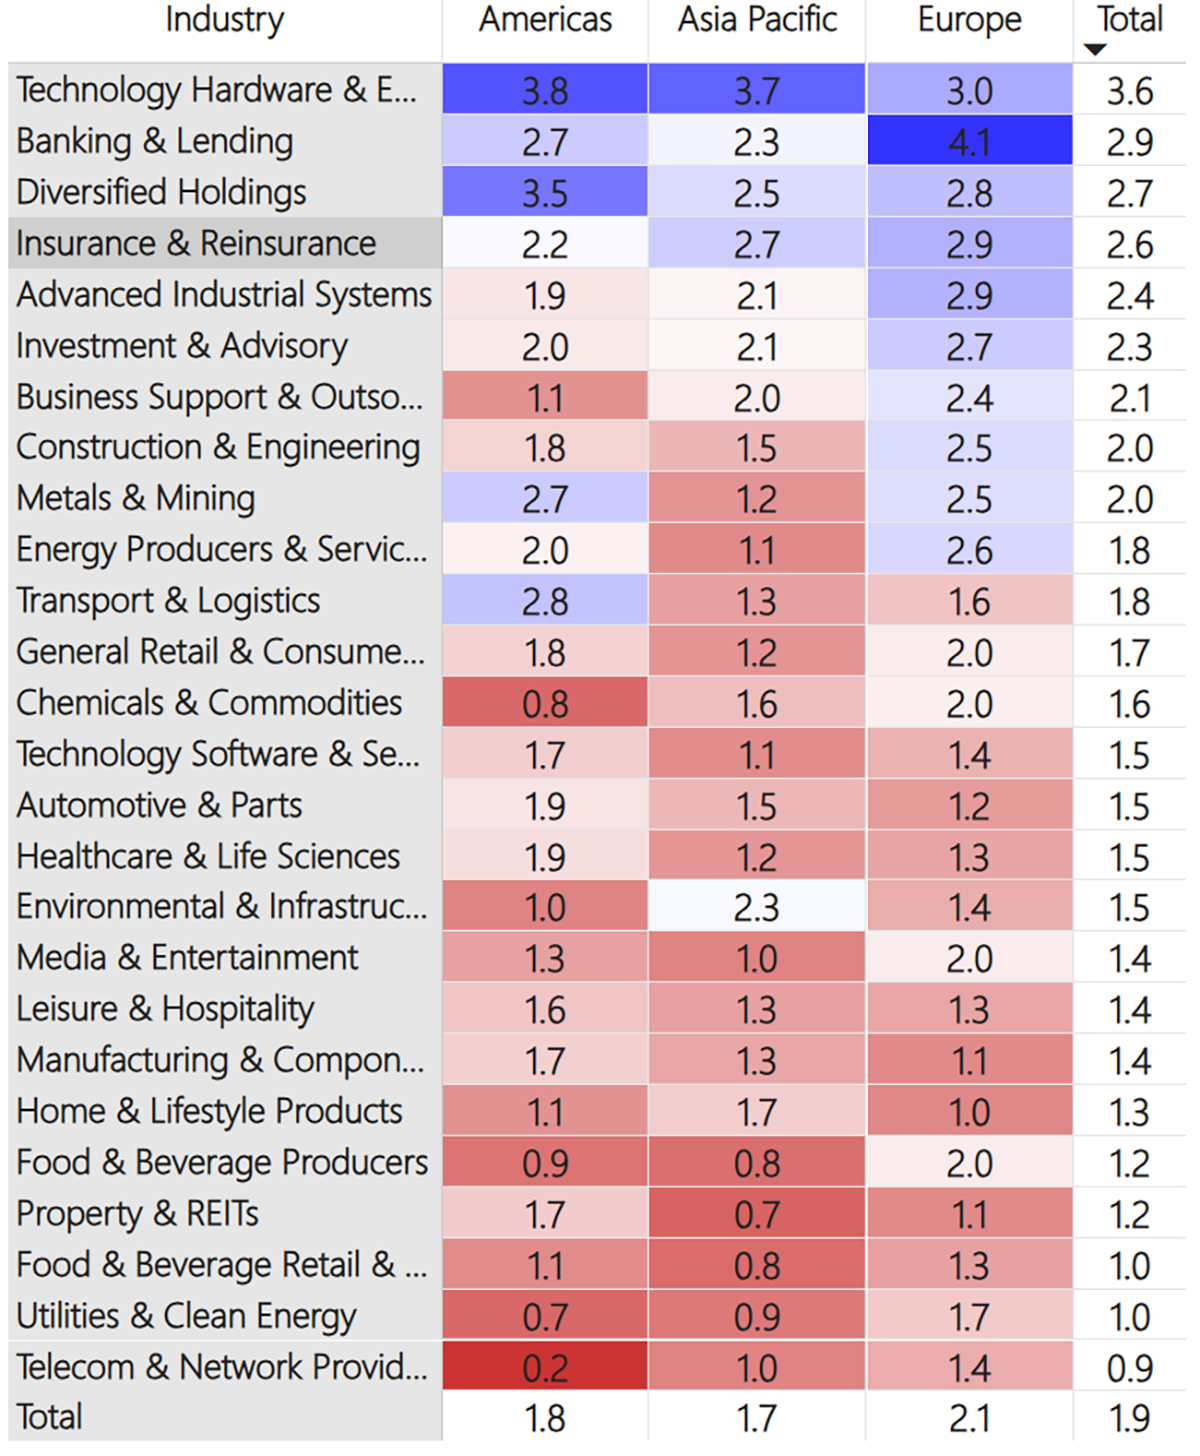
This table (below) shows the average CAPR score for each global industry, by region and in total.
Tech Hardware bounced last week and retains top spot, but software is catching up and is now mid-table, with its highest average CAPR score since September 2025. Autos and Media & Entertainment stocks are also building momentum, rising up the ranks.
Financials weakened last week, as Banking and Insurance both slipped. Energy was the biggest loser, as peace talks dominated the headlines once again. I say headlines, because there remains no concrete peace, and ships are still not moving through the Strait.
At the bottom of the table, Telecoms are the new biggest losers, as their defensive credentials are not getting much attention, and Utilities dropped sharply to join them in the bottom two. The power demands of AI had driven Utilities near the top of the rankings in March, but they are the first major victim of the rotation out of the AI trade.
User Guide
Refer to our GTI: User Guide for an overview of the key concepts and terminology used in this report. These concepts may take a little bit of getting used to, but they are very powerful once you do.
Leading Trends with New Highs
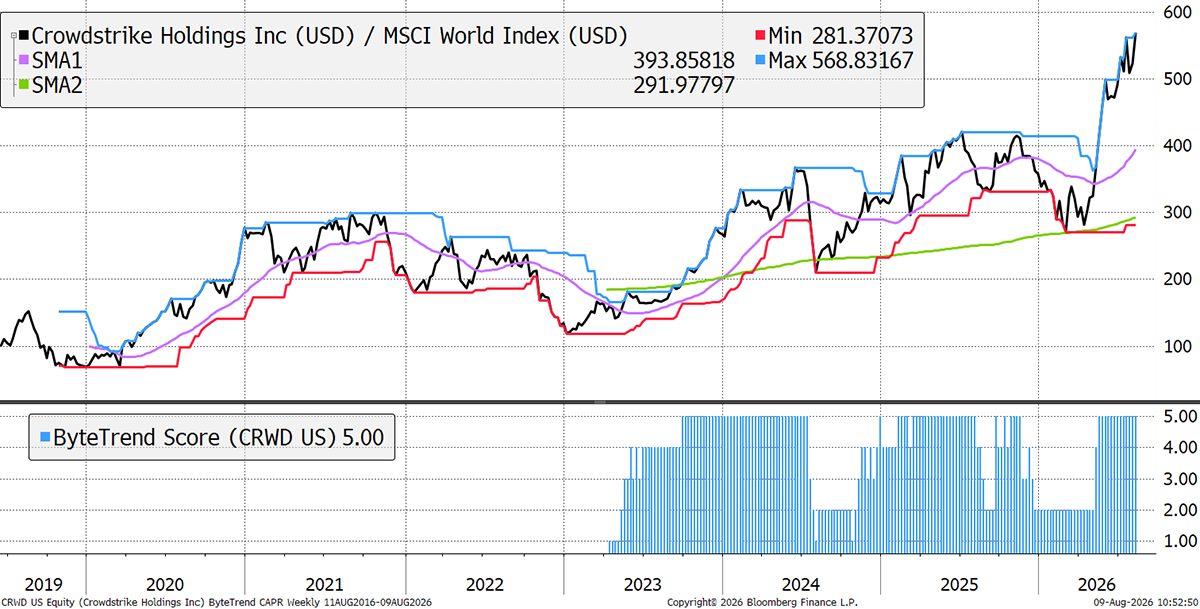
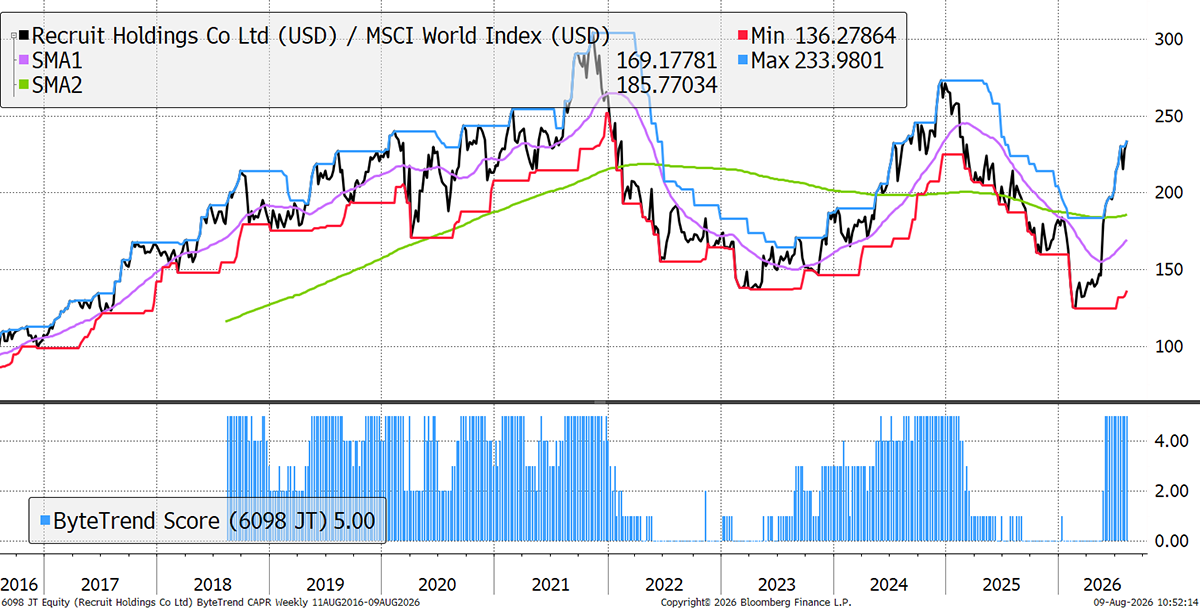
These stocks are trading at the 30-week CAPR highs with a ByteTrend Score of 5. All charts shown are CAPR rebased to 100.
| Name | Annual Vol 30w | Mkt Cap $Bn | Industry |
| CrowdStrike Holdings, Inc. | 60 | 218 | Technology Software & Services |
| Banco Santander, S.A. | 31 | 218 | Banking & Lending |
| UniCredit S.p.A. | 32 | 147 | Banking & Lending |
| Intesa Sanpaolo S.p.A. | 27 | 139 | Banks |
| Recruit Holdings Co., Ltd. | 52 | 116 | Business Support & Outsourcing |
| Cloudflare, Inc. | 62 | 107 | Technology Software & Services |
| Oversea-Chinese Banking Corporation Limited | 18 | 106 | Banking & Lending |
| Wiwynn Corporation | 72 | 106 | Technology Hardware & Equipment |
| Société Générale S.A. | 36 | 71 | Banking & Lending |
| WuXi AppTec Co., Ltd. | 44 | 71 | Healthcare & Life Sciences |
| Hewlett Packard Enterprise Company | 50 | 70 | Technology Hardware & Equipment |
| Garmin Ltd. | 42 | 60 | Technology Hardware & Equipment |
CrowdStrike Holdings
After software stocks collapsed in early 2026 on AI disruption fears, the first group to recover was the cybersecurity stocks. People quickly realised that the faster AI developed, the greater the threat of complex cyber-attacks and the more important these companies became. CrowdStrike is a flagbearer for the sector and has led the way.
Recruit Holdings
Japanese human resources giant Recruit is reshaping the industry. It is pulling together sites like Glassdoor and Indeed, growing its already large job-seeking platform. This enhanced ability to recommend and match job seekers with roles is squeezing traditional human-driven recruitment firms, who are shifting into more niche/specialist/senior matchmaking. Last week, it announced 19% sales growth YoY, with EPS rising 73%.
New Leading Trends
These stocks are trading at the 30-week CAPR highs with a ByteTrend Score of 5, except they are new trends this week, having previously had a score below 5. All charts shown are CAPR rebased to 100.
| Name | Annual Vol 30w | Mkt Cap $Bn | Industry |
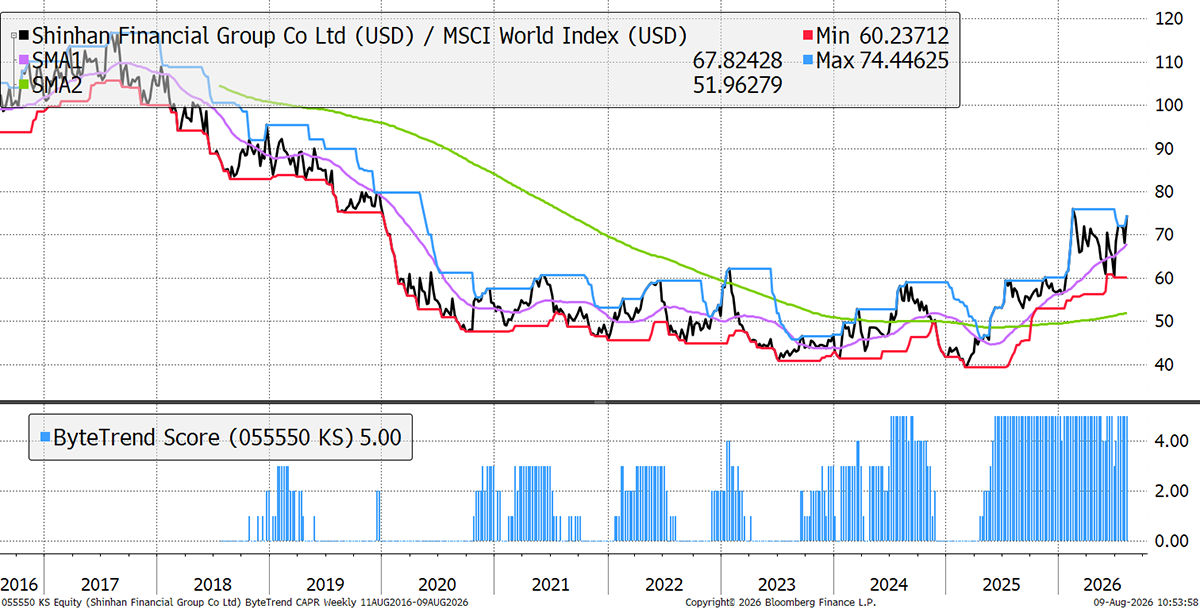
| Shinhan Financial Group Co., Ltd. | 46 | 37 | Banking & Lending |
Shinhan Financial
Shinhan is a Korean financial group, offering banking, insurance, securities trading, and investment banking. Given the boom in margin-driven trading in Korea, it’s no surprise to see it having a strong year (rising sales and earnings, well capitalised). How linked the economy is to the stockmarket remains a key question. For now, it favours Shinhan, but with such volatility at such scale, the risk of bad loans is high.
Emerging Trends
These stocks are trading at the 30-week CAPR highs with a ByteTrend Score of less than 5. They don’t have to be in an uptrend, just emerging. All charts shown are CAPR rebased to 100.
| Name | Annual Vol 30w | Mkt Cap $Bn | Industry |
| Snowflake Inc. | 85 | 115 | Technology Software & Services |
| Airbnb, Inc. | 37 | 106 | Leisure & Hospitality |
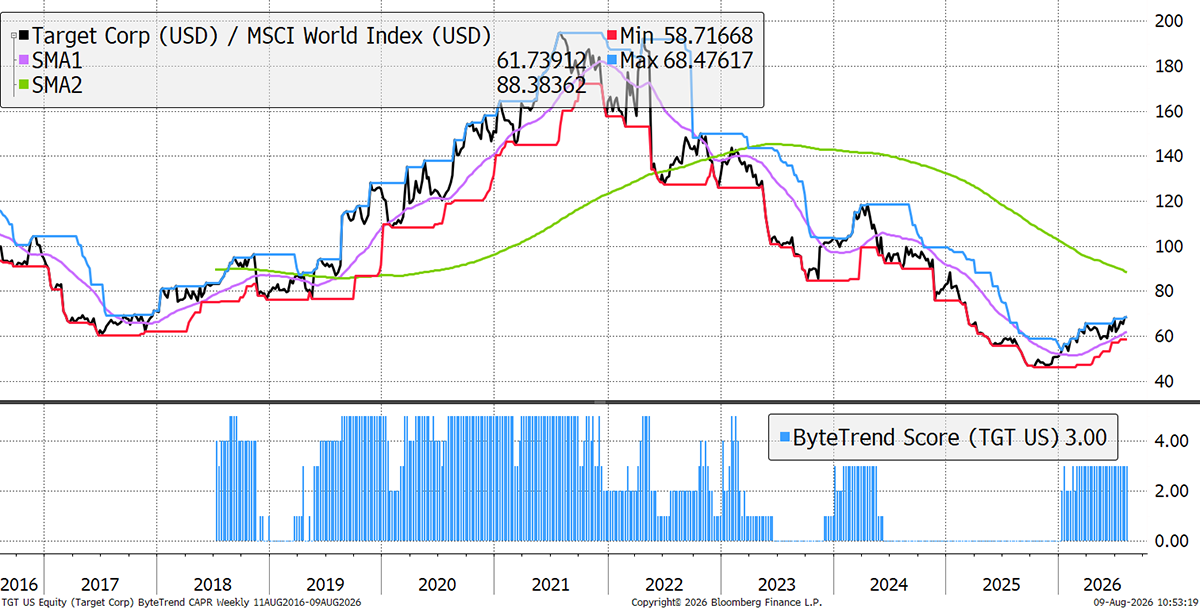
| Target Corporation | 31 | 68 | Food & Beverage Retail & Distribution |
Target Corp
Target is a big, boring, excellent US general retailer akin to Walmart. While Walmart traded at 50x earnings recently, Target sat at 10x. This wide mismatch has now begun to reverse, as recent results showed net sales growth of 6.7% YoY, driven by both store and online traffic, with adjusted EPS rising 32%.
Weakening
These stocks are trading at the 30-week CAPR lows with a ByteTrend Score above 0. They are weakening trends but not yet downtrends. All charts shown are CAPR rebased to 100.
| Name | Annual Vol 30w | Mkt Cap $Bn | Industry |
| Saudi Arabian Oil Company | 14 | 1709 | Energy Producers & Services |
| Walmart Inc. | 28 | 890 | Food & Beverage Retail & Distribution |
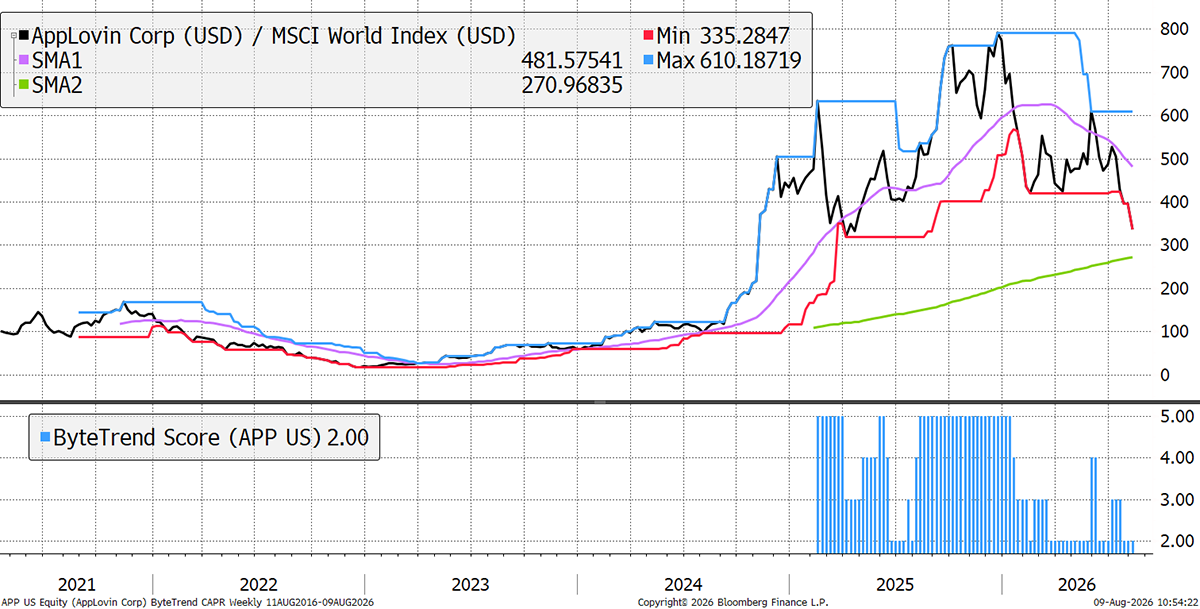
| AppLovin Corporation | 76 | 117 | Technology Software & Services |
| Enbridge Inc. | 24 | 112 | Energy Producers & Services |
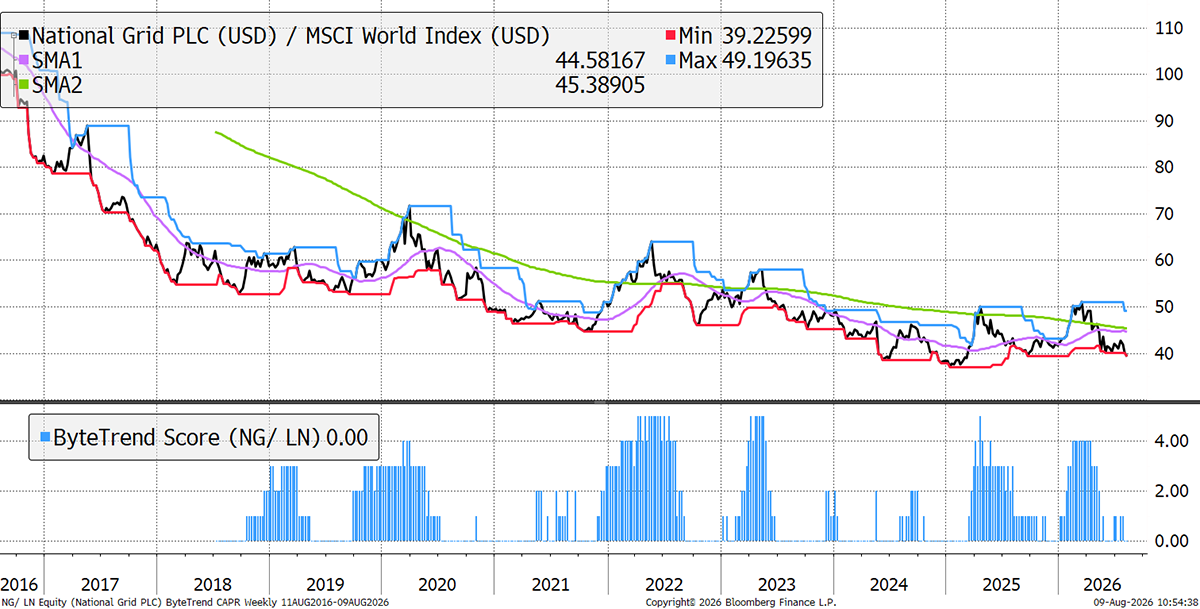
| National Grid plc | 29 | 81 | Utilities & Clean Energy |
| Hilton Worldwide Holdings Inc. | 21 | 71 | Leisure & Hospitality |
| Warner Bros. Discovery, Inc. | 13 | 67 | Media & Entertainment |
| Singapore Telecommunications Limited | 20 | 55 | Telecom & Network Providers |
| Loblaw Companies Limited | 23 | 52 | Food & Beverage Retail & Distribution |
| Corteva, Inc. | 26 | 51 | Chemicals & Commodities |
AppLovin
This is a high-growth (60% plus) advertising platform, highly data-driven. Last September, AppLovin traded at 100x earnings, while former leader WPP traded at 10x. While WPP posted results that showed less of a decline than expected and rose by 25%, AppLovin fell 20% in a day last week as revenues disappointed. Prices reflect expectations, and these matter enormously.
National Grid
National Grid operates the UK’s electricity grid, and also some in northeast America. It made the UK’s largest rights issuance in a decade, raising £10bn from investors, to fund sorely needed upgrades across its UK/US networks, be they transmission (long-range) or distribution (to customers) of gas or renewable electricity. Its prices are protected from inflation by government contract, and its customer base has nowhere else to turn. Such a regulated asset faces little competition, but equally, offers little growth, and investors remain focused on the latter for now.
Bear Trends
These stocks are trading at the 30-week CAPR lows with a ByteTrend Score of 0. They are in a downtrend. All charts shown are CAPR rebased to 100.
| Name | Annual Vol 30w | Mkt Cap $Bn | Industry |
| The Procter & Gamble Company | 19 | 347 | Home & Lifestyle Products |
| Roche Holding AG | 15 | 318 | Healthcare & Life Sciences |
| Nestlé S.A. | 24 | 259 | Food & Beverage Producers |
| AstraZeneca PLC | 30 | 249 | Healthcare & Life Sciences |
| McDonald's Corporation | 18 | 195 | Food & Beverage Producers |
| T-Mobile US, Inc. | 31 | 190 | Telecom & Network Providers |
| PepsiCo, Inc. | 25 | 190 | Food & Beverage Producers |
| NextEra Energy, Inc. | 19 | 177 | Utilities & Clean Energy |
| HDFC Bank Limited | 23 | 118 | Banking & Lending |
| The Southern Company | 18 | 107 | Utilities & Clean Energy |
| Sanofi | 20 | 105 | Healthcare & Life Sciences |
| Al Rajhi Banking and Investment Corporation | 13 | 103 | Banking & Lending |
| AIA Group Limited | 31 | 97 | Insurance & Reinsurance |
| Duke Energy Corporation | 19 | 97 | Utilities & Clean Energy |
| Marsh & McLennan Companies, Inc. | 11 | 90 | Insurance & Reinsurance |
| Cigna Corporation | 23 | 75 | Healthcare & Life Sciences |
| Chugai Pharmaceutical Co., Ltd. | 31 | 72 | Healthcare & Life Sciences |
| American Electric Power Company, Inc. | 26 | 68 | Utilities & Clean Energy |
| Vale S.A. | 29 | 63 | Construction & Engineering |
| NIKE, Inc. | 36 | 62 | General Retail & Consumer Goods |
| Saudi Telecom Co. | 11 | 58 | Telecom & Network Providers |
| Sempra | 26 | 55 | Utilities & Clean Energy |
| Hindustan Unilever Limited | 18 | 52 | Home & Lifestyle Products |
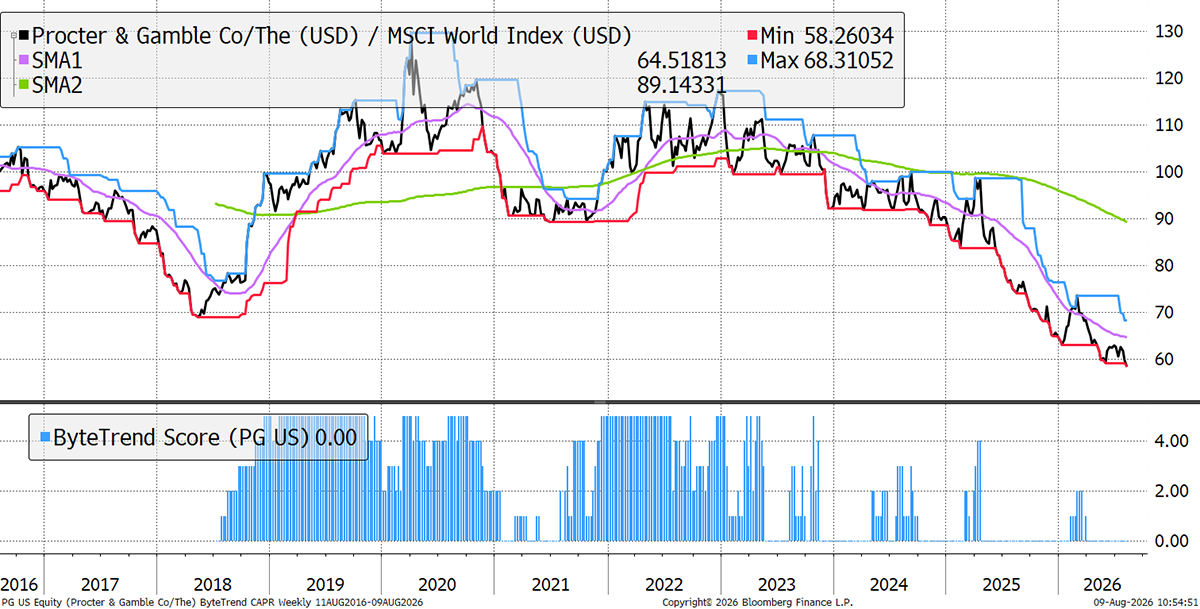
Procter & Gamble
A theme today has been comparisons. Consumer staples stocks more broadly are enjoying a strong couple of months, as they were unloved and cheap. However, this is mainly true in Europe. P&G traded at a wide premium to its peers, based on higher returns on invested capital and a clear, stronger portfolio of brands. Peers are copying its portfolio management, divesting underperforming brands. Its 50-100% premium over Unilever, for example, is now shrinking, as ULVR has risen 10% in price since June, while PG has gone nowhere.
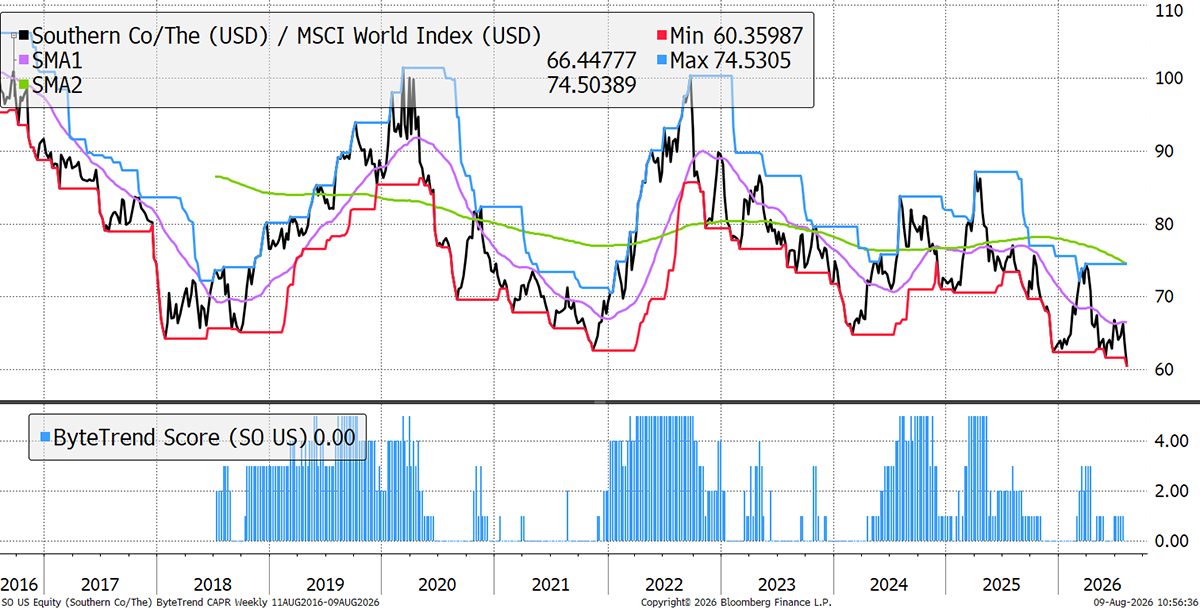
Southern Co
Southern is a regulated US utility, serving gas and electricity to 9 million customers. Data centre demand is driving power costs higher in the US, causing social and political issues, while the AI association has hurt it recently. Revenues missed guidance at its latest results, with weak growth, and heavy capital expenditures (needing more debt, higher interest payments, etc) look riskier if they’re not translating into better sales.
GTI 200 Spreadsheet
We are pleased to share the GTI 200 spreadsheet. Download the spreadsheet below to view the CAPR and local currency scores, and more, for the world’s largest 200 stocks. Have a look at the different groups and the main list “All stocks”. The Insights tab is interesting, and don’t forget to expand the columns by clicking on the “+” at the top of the page if you want to see more trend data.
Outlook
The market remains buoyant and the rotation we have referred to as Jaws continues. That said, the leaders have found support but are a thin group. Recall it takes time to turn a 200-week moving average, and so this rotation should continue for a while.
Thanks for reading GTI.


