


Spreading the Love


Issue 78;
- Technology rebounds, large-caps and defensives ease back.
- Slump in Emerging Markets.
- What don’t we know about utilities?
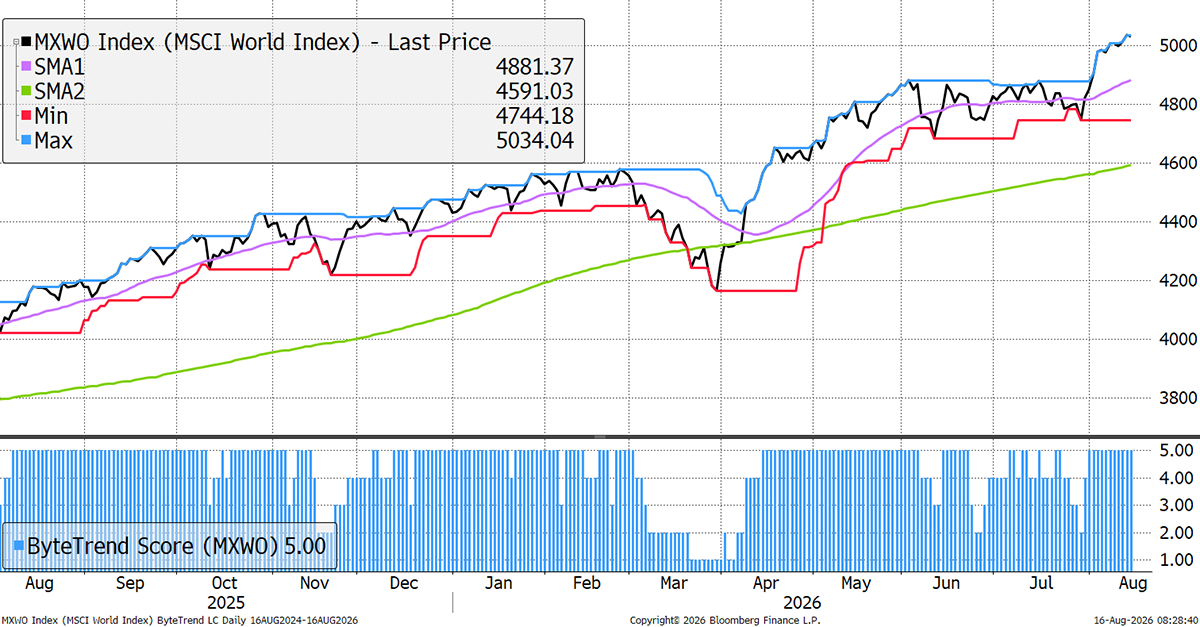
The World Index holds a ByteTrend Score of 5 in USD and makes a new all-time high.
World Index – Developed Markets – Daily
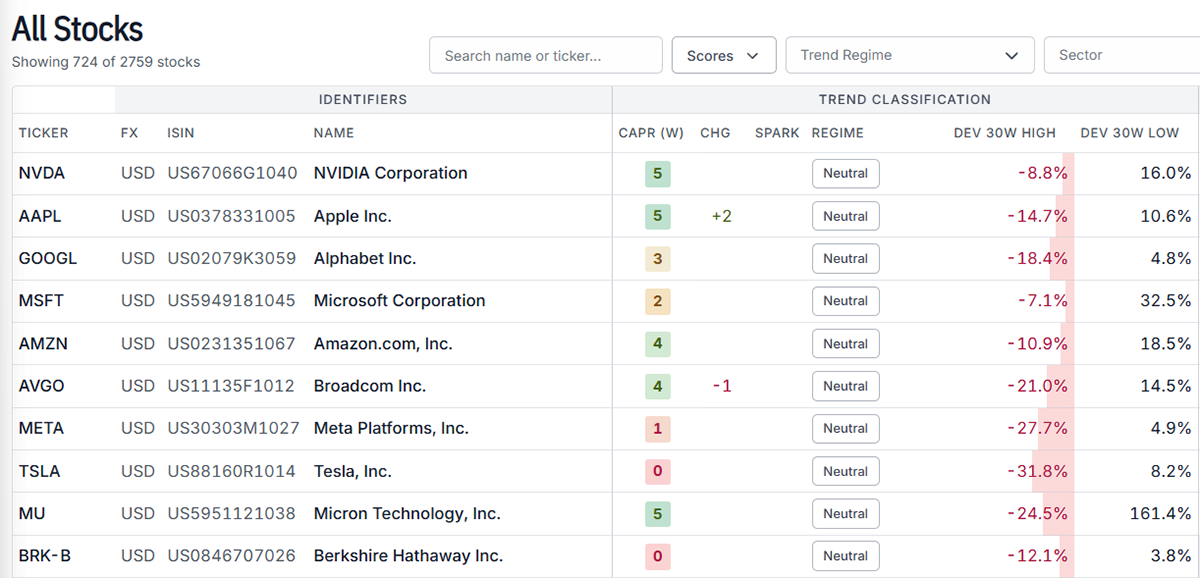
US Top Ten Stocks
Looking at the largest US stocks, the 5-score stocks are all in tech hardware, with the average around 20% below its 30-week high. This is a $27 trillion bunch, and it is remarkable that the World Index made a convincing new high despite this correction in large stocks. It means everything else has shunted higher to compensate.
US Size
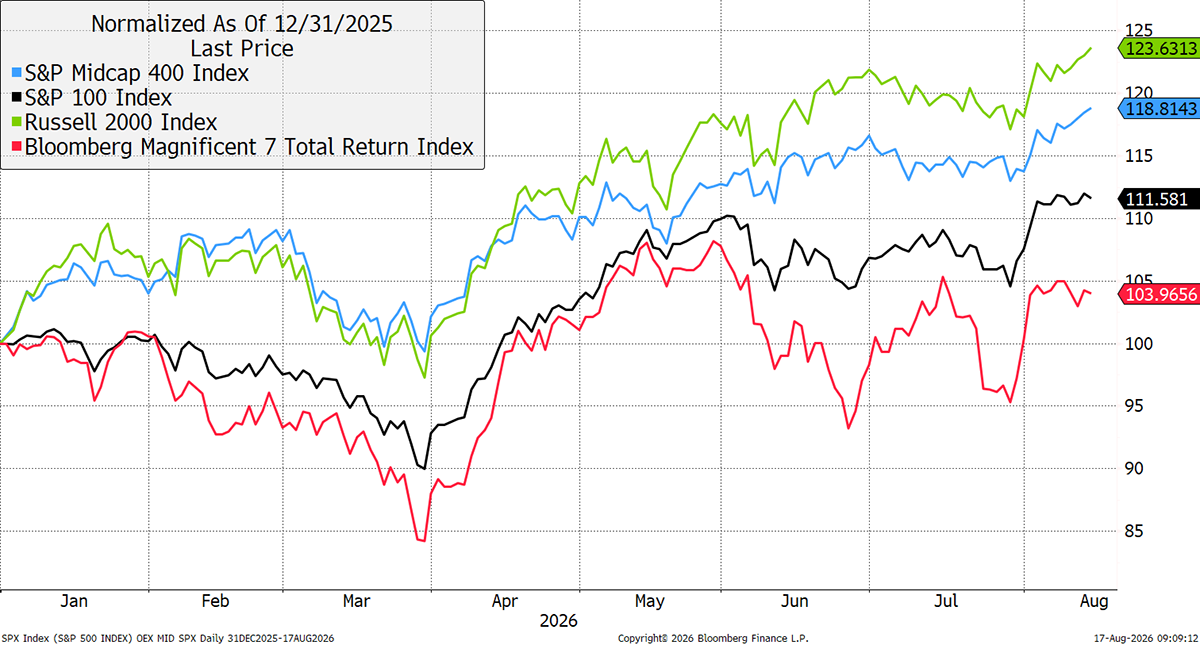
This year, the Magnificent 7 are up just 4%, and the top 100 are up 11.6%, while the mid-caps are up 18.8%. The small? 23.6%. It is the many, rather than the few, that are driving the World Index. We call this spreading the love.
Emerging Markets
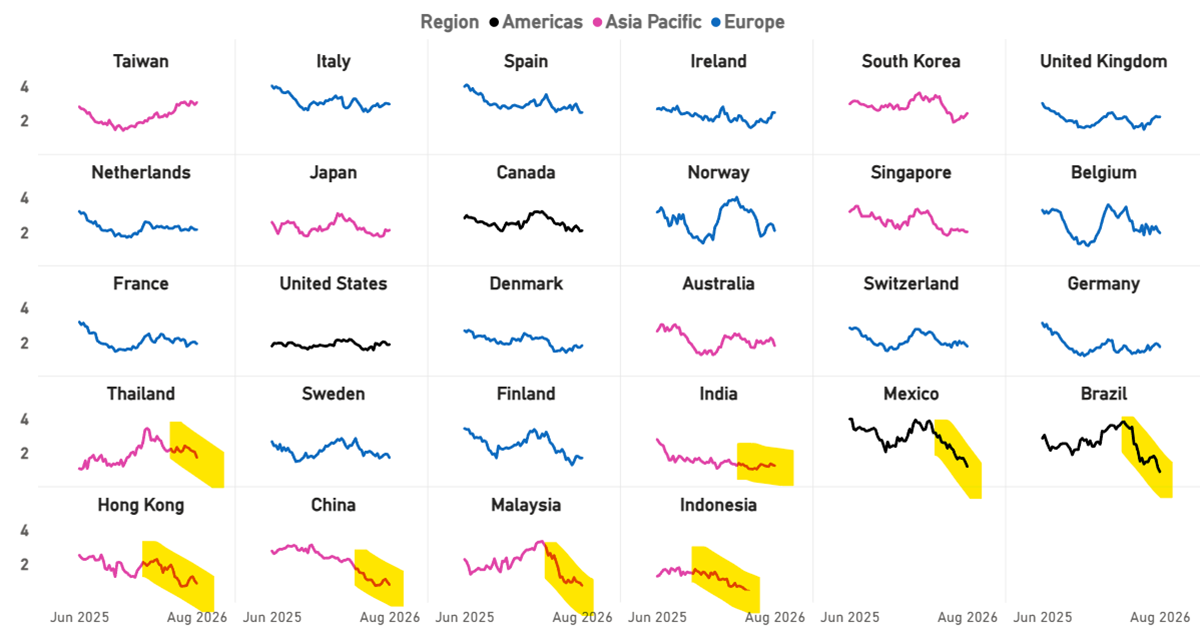
While the EM Index is fully loaded with tech hardware in Korea and Japan, the other EM countries are slumping. Latin America is weak, along with China and the Asian Tigers. Could this be warning us of a global growth scare? The signal normally comes from the EMs.
Global Breadth – Local Currency
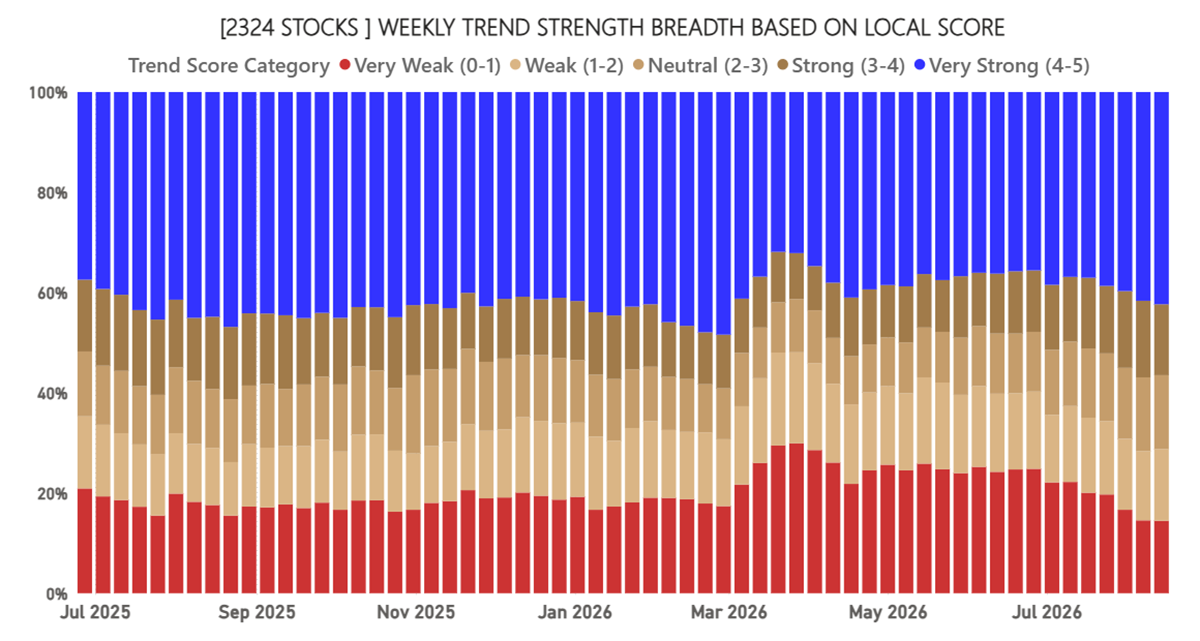
Yet breadth continues to improve, with more (blue) uptrends. Yet the leadership remains thin.
Net Winners
The winners-less-losers metric guides asset allocators. We continue to see finance, tech, and industrials drive this market. Defensives, communications, and utilities have waned.

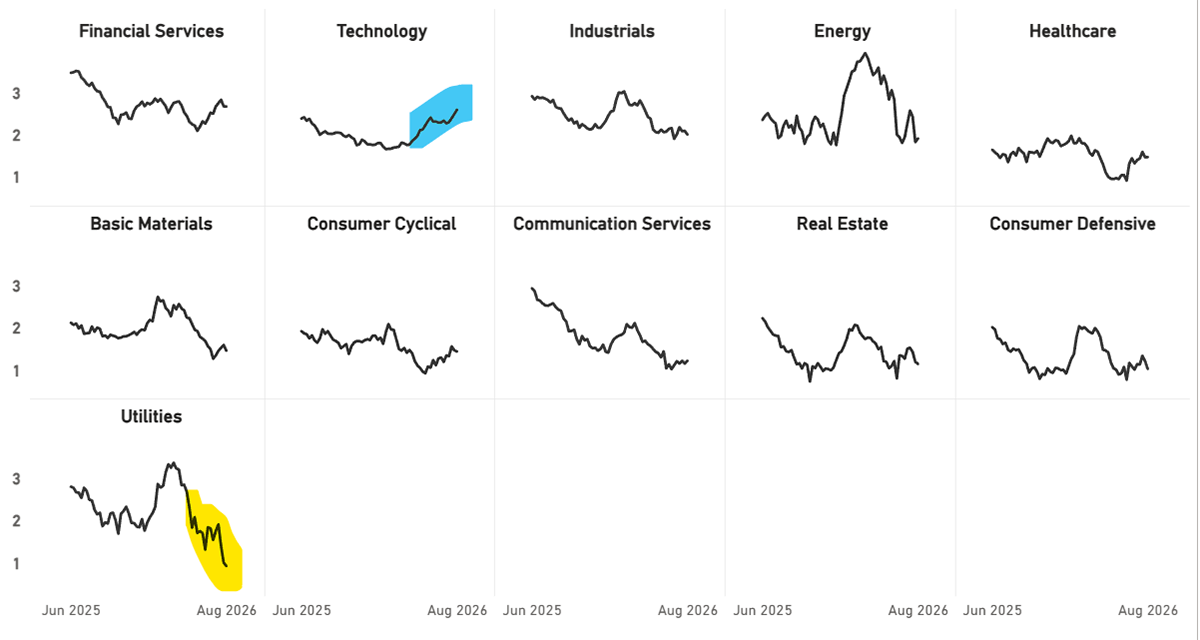
Sectors – Average Trend Score
Tech is bouncing, dominated by software, but what is happening with utilities? Are there doubts growing about future electricity consumption by AI?
Trend Type Performance – CAPR
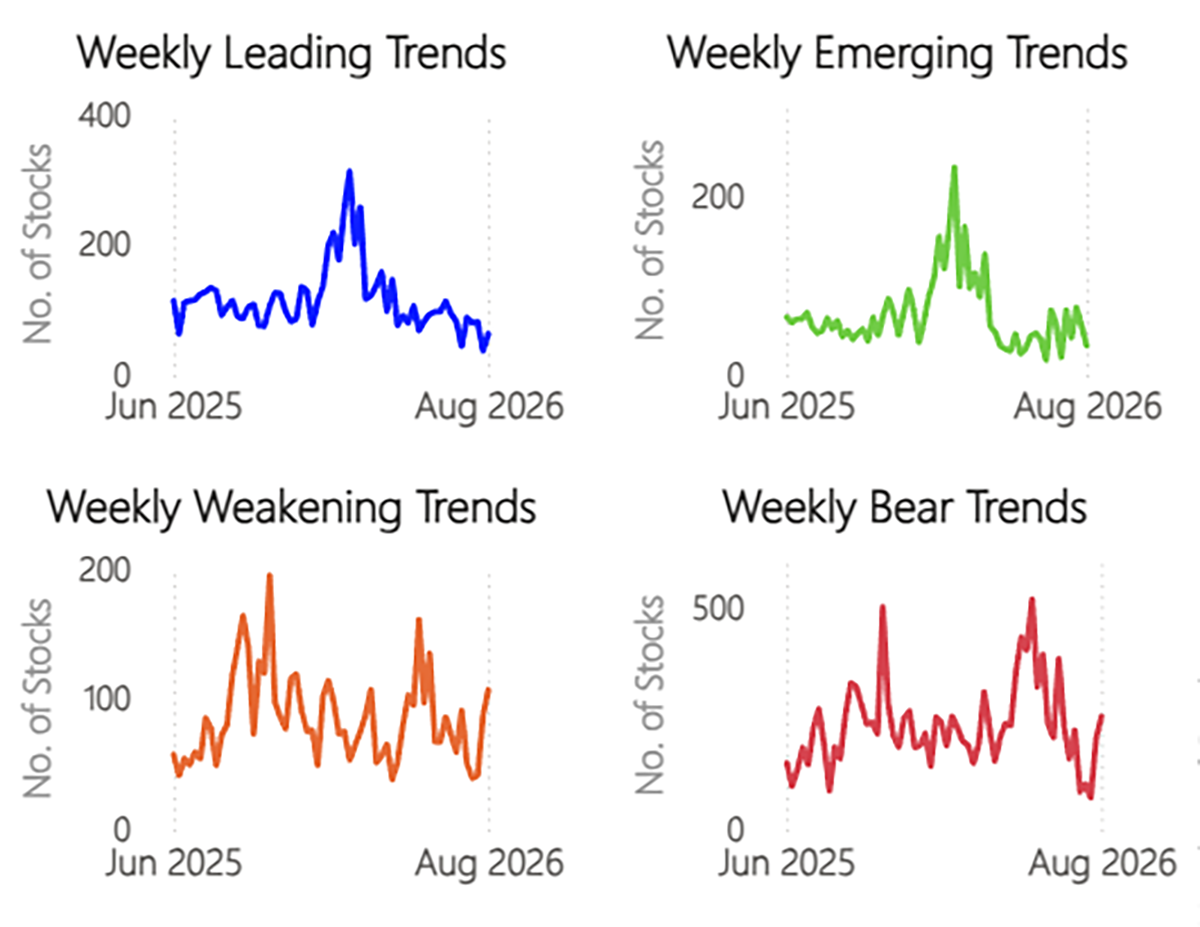
There are still only a few positive new trends in CAPR, and many more negative trends. This highlights how hard this market is still to beat.
Trend Type Performance
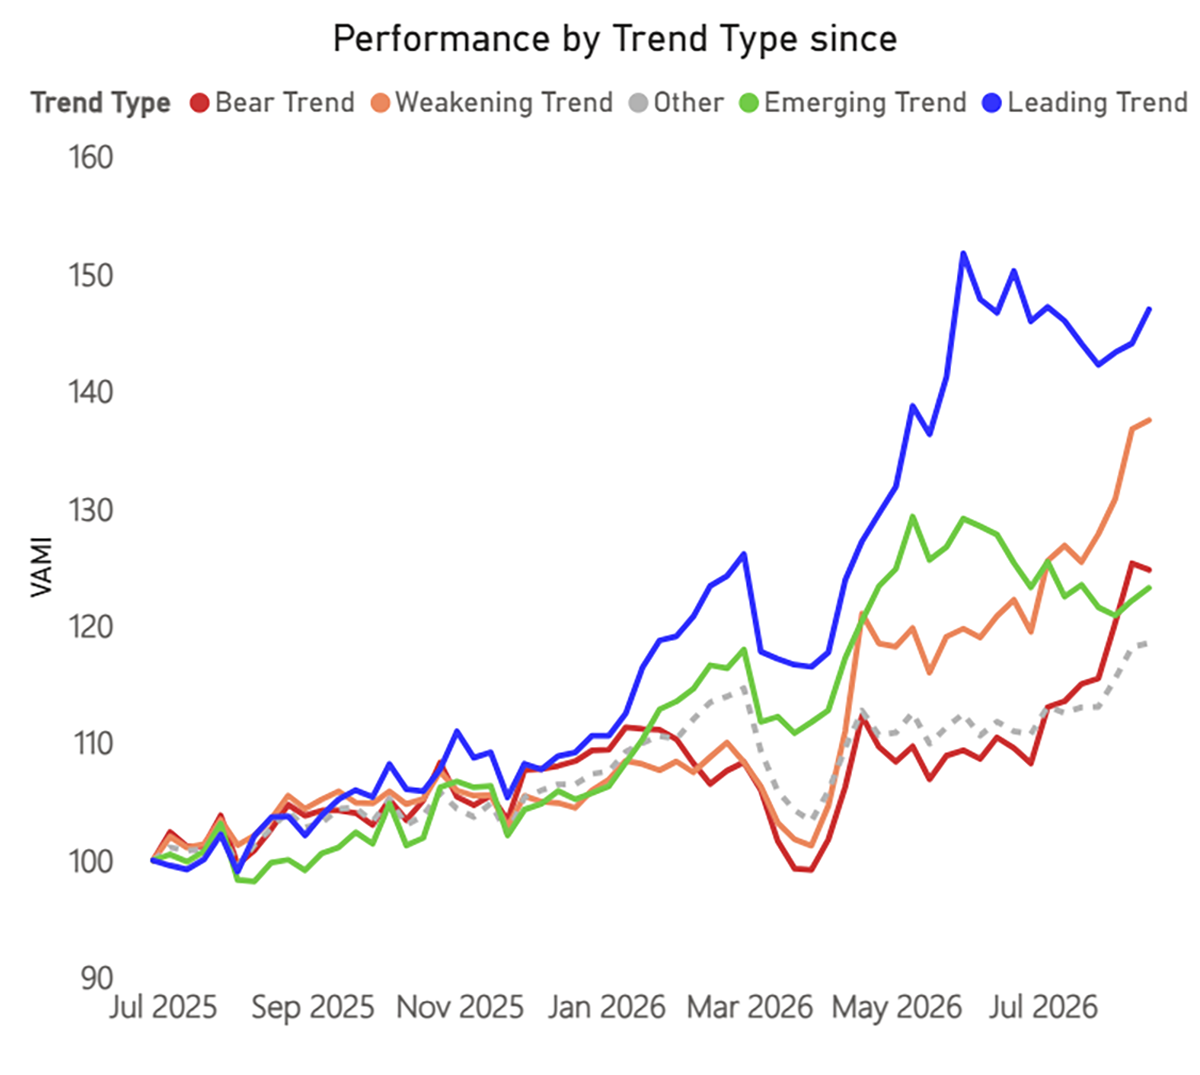
The leaders have bounced, while the bear has retreated. The jaws are widening this week for the first time since May.
Regions and Industries Average Relative Score
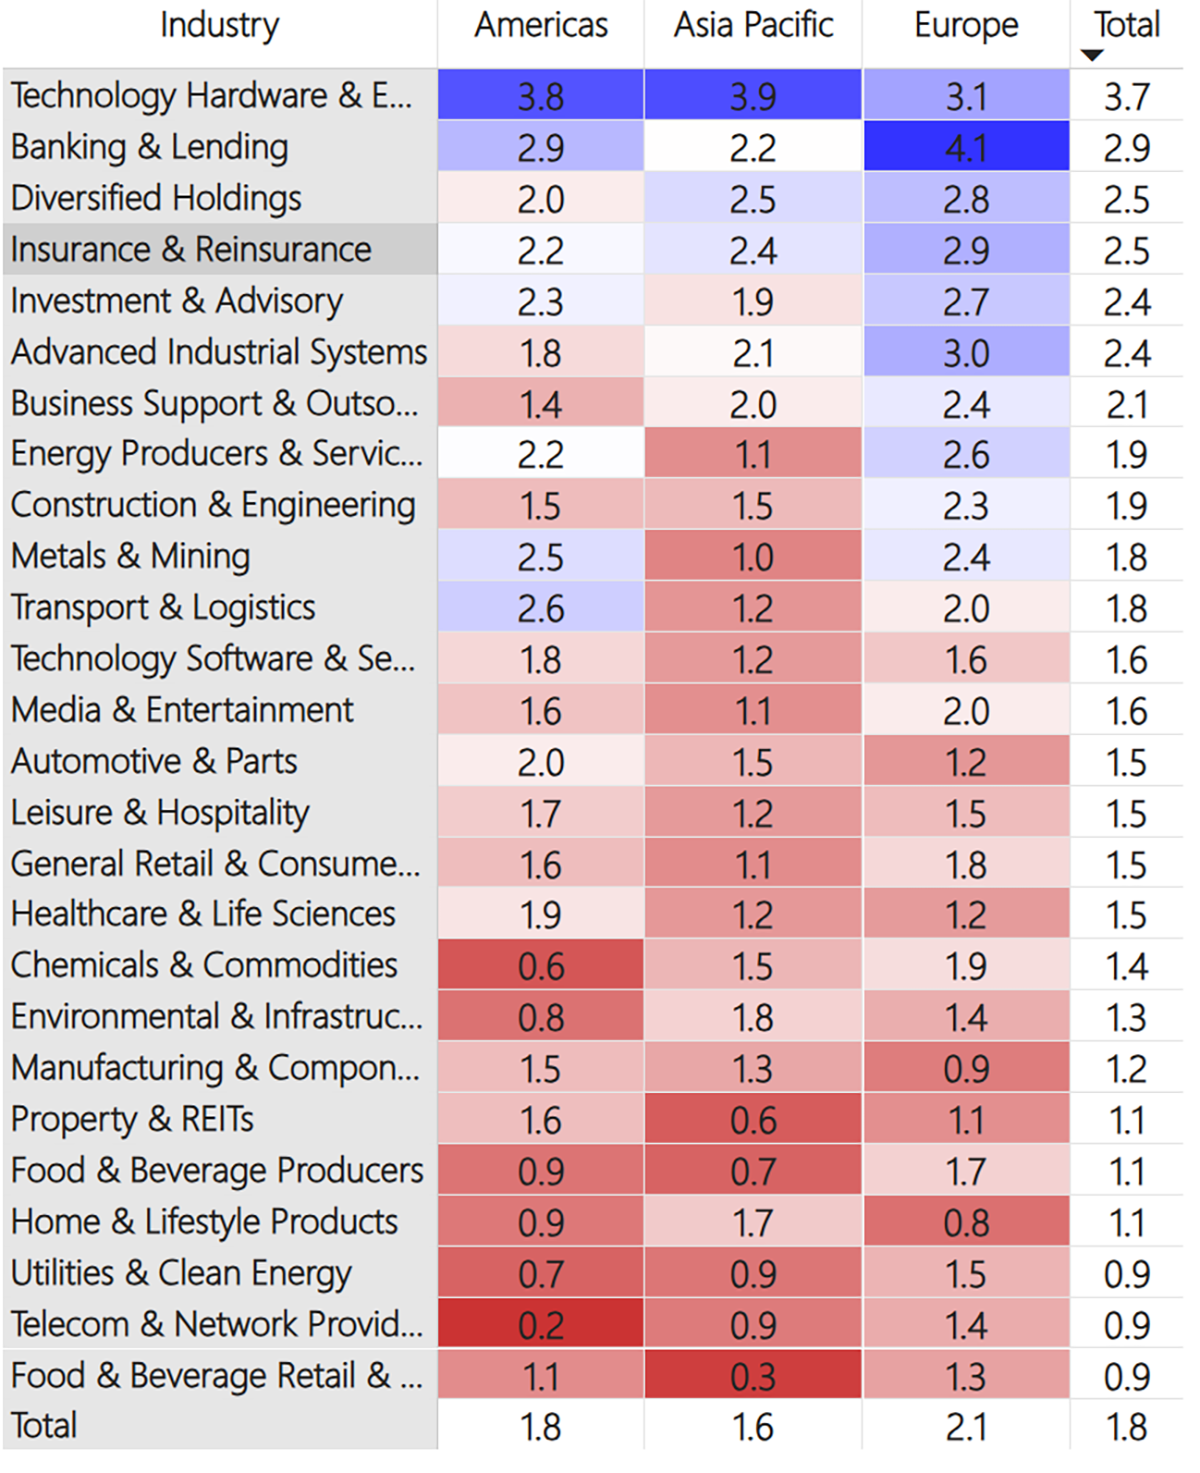
This table (below) shows the average CAPR score for each global industry, by region and in total.
Tech Hardware continued to bounce last week and is stretching its lead at the top of the table once again. Financials, led by insurance, continued to weaken, while Investment stocks bucked the trend as continued high trading volumes supported them. Software continues its rise up the table, and Media and Entertainment bounced too.
At the bottom of the table, Healthcare has weakened over the last couple of weeks as the rotation has taken a pause, and Chemicals, Food & Beverage, Home & Lifestyle (Luxury), Property, Infrastructure, and other stocks have struggled too. Utilities continued their descent after a sharp drop last week, and there is still no joy for Telecoms either.
User Guide
Refer to our GTI: User Guide for an overview of the key concepts and terminology used in this report. These concepts may take a little bit of getting used to, but they are very powerful once you do.
Leading Trends with New Highs
These stocks are trading at the 30-week CAPR highs with a ByteTrend Score of 5. All charts shown are CAPR rebased to 100.
| Name | Annual Vol 30w | Mkt Cap $Bn | Industry |
| Dell Technologies Inc. | 80 | 326 | Technology Hardware & Equipment |
| Palo Alto Networks, Inc. | 56 | 313 | Technology Software & Services |
| Arista Networks, Inc. | 53 | 250 | Technology Hardware & Equipment |
| CrowdStrike Holdings, Inc. | 59 | 221 | Technology Software & Services |
| Rolls-Royce Holdings plc | 40 | 172 | Advanced Industrial Systems |
| Advantest Corporation | 57 | 168 | Technology Hardware & Equipment |
| UniCredit S.p.A. | 32 | 148 | Banking & Lending |
| Recruit Holdings Co., Ltd. | 60 | 144 | Business Support & Outsourcing |
| Intesa Sanpaolo S.p.A. | 27 | 141 | Banks |
| Wiwynn Corporation | 70 | 112 | Technology Hardware & Equipment |
| Cloudflare, Inc. | 62 | 112 | Technology Software & Services |
| Oversea-Chinese Banking Corporation Limited | 18 | 112 | Banking & Lending |
| Marathon Petroleum Corporation | 46 | 104 | Energy Producers & Services |
| Valero Energy Corporation | 40 | 98 | Energy Producers & Services |
| Phillips 66 | 39 | 94 | Energy Producers & Services |
| Hewlett Packard Enterprise Company | 50 | 78 | Technology Hardware & Equipment |
| WuXi AppTec Co., Ltd. | 43 | 73 | Healthcare & Life Sciences |
| Crédit Agricole S.A. | 25 | 71 | Banking & Lending |
| KBC Group N.V. | 22 | 60 | Banking & Lending |
| ArcelorMittal S.A. | 45 | 56 | Metals & Mining |
| Lenovo Group Limited | 90 | 53 | Technology Hardware & Equipment |
| Nan Ya Plastics Corporation | 77 | 51 | Chemicals & Commodities |
| Commerzbank AG | 30 | 50 | Banking & Lending |
Dell Technologies
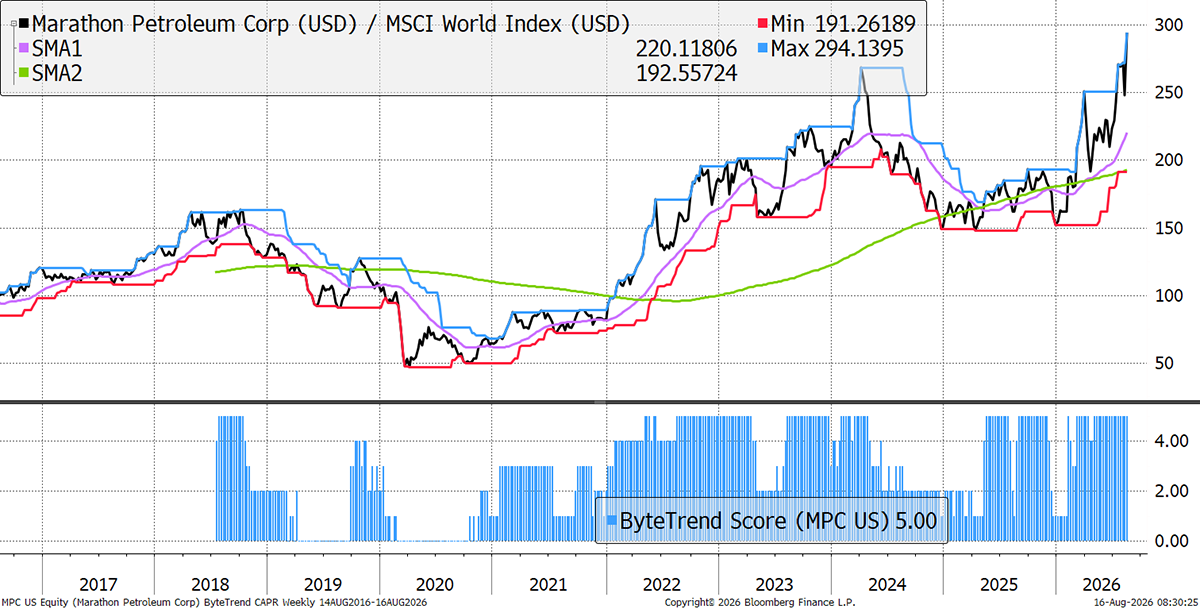
Tech Hardware isn’t just bouncing; some major constituents are breaking out to new CAPR highs. Dell exemplified the wildness of the rally in the Spring, rising 300% in a matter of months. It seemed improbable that it could re-accelerate after its recent pause, but it has managed to find another gear. Its peers’ results showed continued strength in demand, and it will report its own results on September 3.
Marathon Petroleum
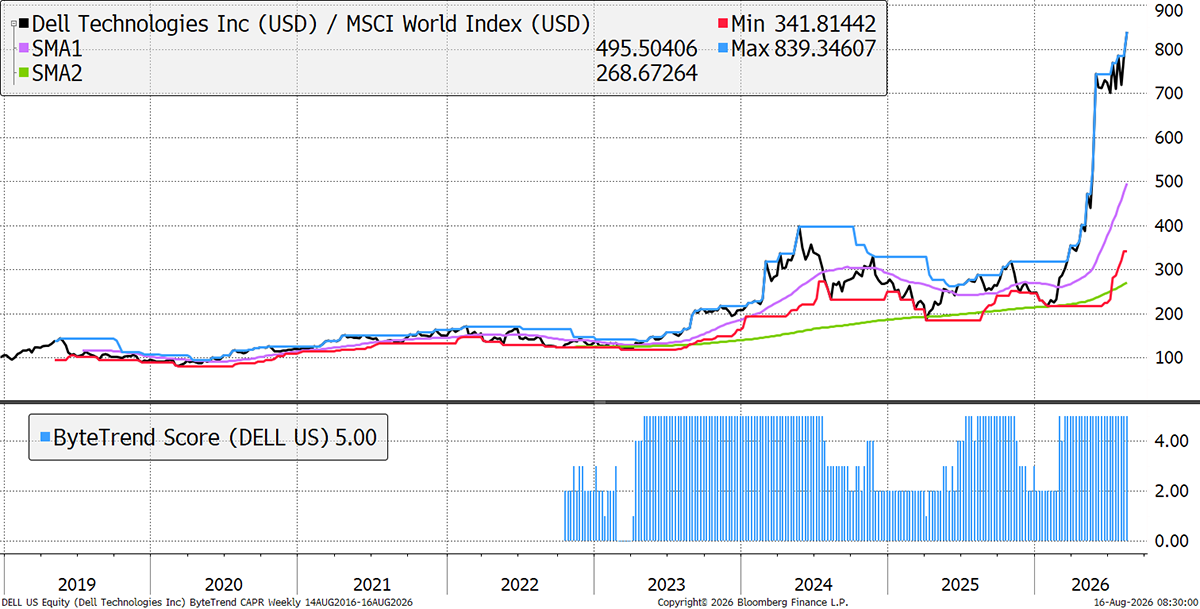
Marathon is rising strongly after it posted a massive Q2 earnings beat driven by record refining margins. While oil prices have remained impressively calm in the absence of flows through Hormuz, the spreads that refiners can earn for converting oil into useful products (e.g. the 3-2-1 spread) have ballooned to record levels, helping refiners like Marathon.
New Leading Trends
These stocks are trading at the 30-week CAPR highs with a ByteTrend Score of 5, except they are new trends this week, having previously had a score below 5. All charts shown are CAPR rebased to 100.
| Name | Annual Vol 30w | Mkt Cap $Bn | Industry |
| A.P. Møller - Mærsk A/S | 46 | 47 | Transport & Logistics |
| Banca Monte dei Paschi di Siena S.p.A. | 44 | 42 | Banking & Lending |
| Expedia Group, Inc. | 52 | 38 | Leisure & Hospitality |
| MongoDB, Inc. | 66 | 37 | Technology Software & Services |
AP Moller Maersk
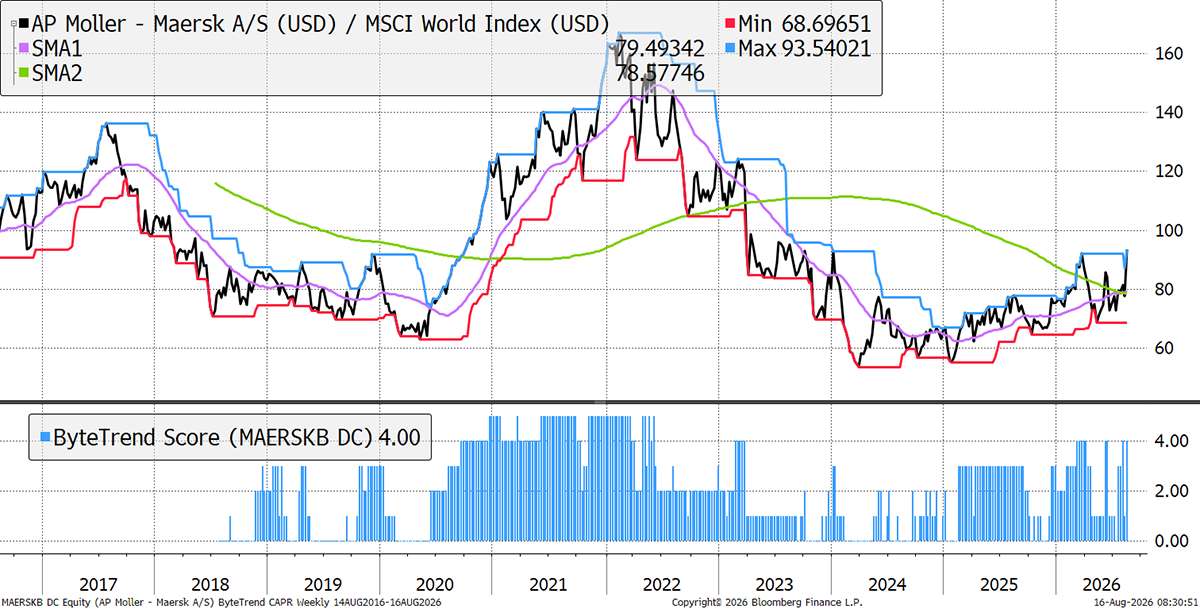
AP Moller Maersk just delivered a very strong Q2, with 20% revenue growth driven by Far East exports. It raised full‑year guidance again, and is benefiting from a cyclical upswing in ocean freight rates and volumes. Free cash flow turned strongly positive after last year’s loss. It has four services currently operating in the Red Sea/Bab-el-Mandeb Strait, which is roughly a third of normal volumes.
Emerging Trends
These stocks are trading at the 30-week CAPR highs with a ByteTrend Score of less than 5. They don’t have to be in an uptrend, just emerging. All charts shown are CAPR rebased to 100.
| Name | Annual Vol 30w | Mkt Cap $Bn | Industry |
| Shopify Inc. | 68 | 200 | Technology Software & Services |
| Airbnb, Inc. | 36 | 109 | Leisure & Hospitality |
| Target Corporation | 31 | 70 | Food & Beverage Retail & Distribution |
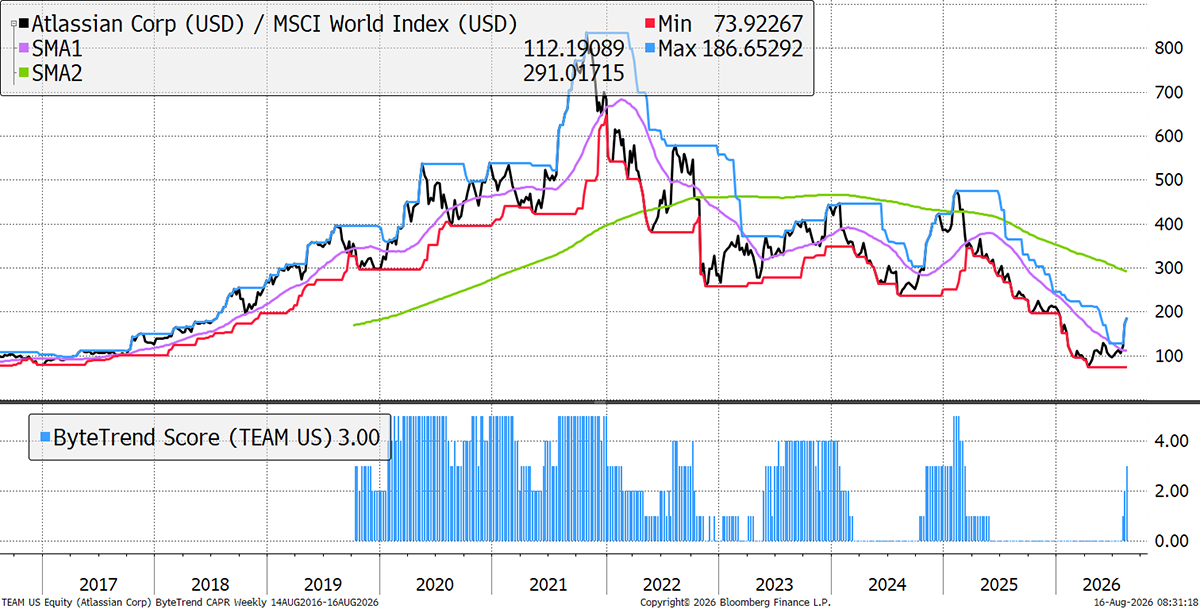
Atlassian
Atlassian is an Australian software giant. It jumped 30% in a day recently, as results showed AI accelerating its growth rather than disrupting it, as so many had feared. This was significant enough to lift the entire software sector too. It saw robust revenue growth, accelerating cloud adoption (+31%), and record enterprise deal activity. Its strategic investments in AI, particularly through the Teamwork Graph and Rovo assistant, are driving deeper platform engagement and durable profitable growth.
Weakening
These stocks are trading at the 30-week CAPR lows with a ByteTrend Score above 0. They are weakening trends but not yet downtrends. All charts shown are CAPR rebased to 100.
| Name | Annual Vol 30w | Mkt Cap $Bn | Industry |
| Novartis AG | 22 | 286 | Healthcare & Life Sciences |
| The TJX Companies, Inc. | 22 | 168 | General Retail & Consumer Goods |
| China Life Insurance Company Limited | 41 | 157 | Insurance & Reinsurance |
| British American Tobacco p.l.c. | 36 | 123 | Home & Lifestyle Products |
| Altria Group, Inc. | 32 | 110 | Home & Lifestyle Products |
| Enel S.p.A. | 27 | 109 | Utilities & Clean Energy |
| Zurich Insurance Group AG | 21 | 109 | Insurance & Reinsurance |
| AppLovin Corporation | 75 | 106 | Technology Software & Services |
| Itaú Unibanco Holding S.A. | 31 | 88 | Banking & Lending |
| Westpac Banking Corporation | 22 | 86 | Banking & Lending |
| National Grid plc | 29 | 81 | Utilities & Clean Energy |
| Engie S.A. | 28 | 76 | Utilities & Clean Energy |
| CRH plc | 34 | 65 | Construction & Engineering |
| E.on Se | 28 | 53 | Utilities & Clean Energy |
| Loblaw Companies Limited | 24 | 52 | Food & Beverage Retail & Distribution |
| Carrier Global Corporation | 38 | 52 | Construction & Engineering |
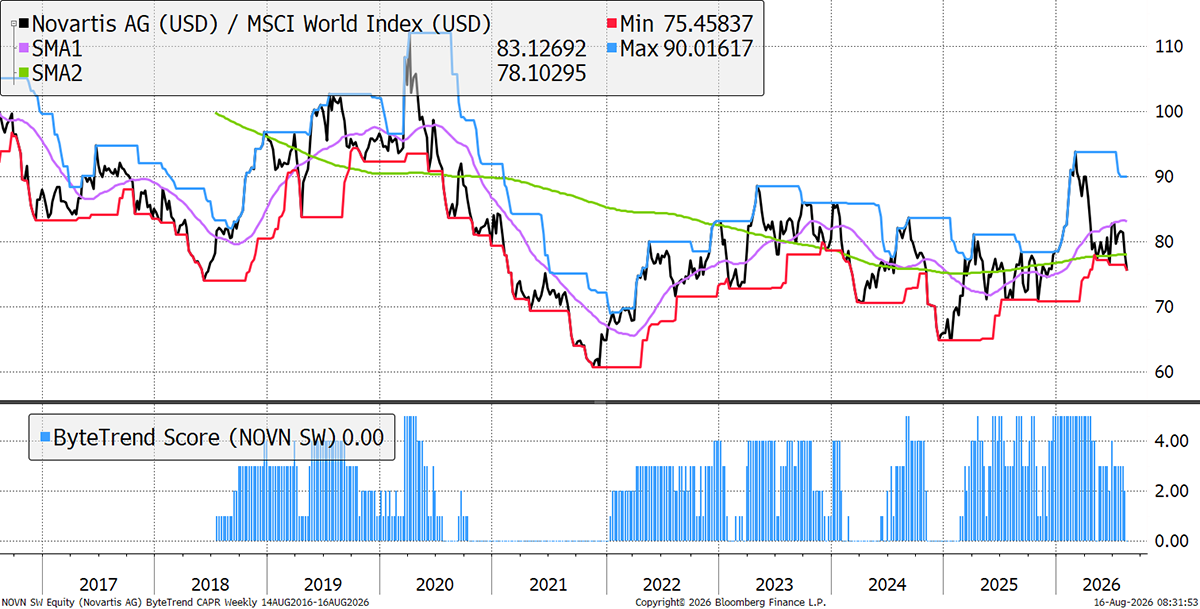
Novartis
Novartis is a globally dominant pharmaceutical company, which had a strong run into February. Like many of its peers, it faces a major period of patent expiries on key drugs, and has an uphill task to replace them. Its pipeline is strong, and it bolstered it with the $12bn acquisition of Avidity Biosciences. Results have been solid, but not enough to offset the recent weakness in the Healthcare sector.
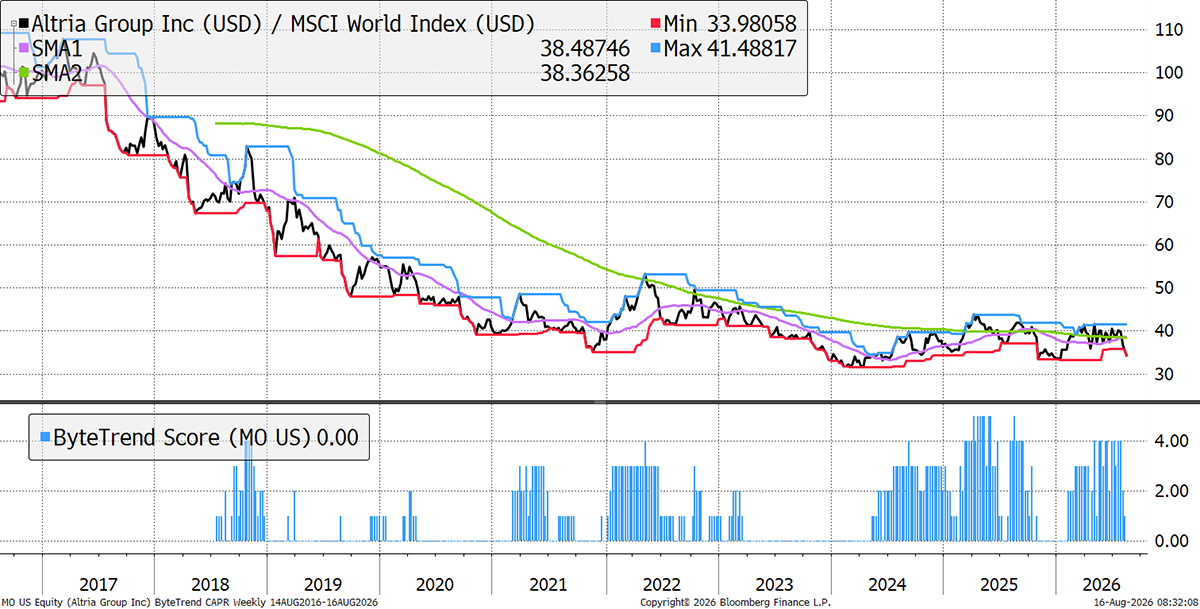
Altria
Cigarette volumes are steadily declining. The question for the big tobacco companies is whether their next-gen offerings like snus, vapes, e-cigarettes and others can offset that. The fear is a growing regulatory burden on the new businesses too, as we await fuller studies on the impact of these products. Also, as a dividend stock, Altria is especially sensitive to interest rates, becoming less attractive in relative terms as they go up.
Bear Trends
These stocks are trading at the 30-week CAPR lows with a ByteTrend Score of 0. They are in a downtrend. All charts shown are CAPR rebased to 100.
| Name | Annual Vol 30w | Mkt Cap $Bn | Industry |
| Saudi Arabian Oil Company | 12 | 1706 | Energy Producers & Services |
| The Procter & Gamble Company | 19 | 344 | Home & Lifestyle Products |
| Roche Holding AG | 15 | 316 | Healthcare & Life Sciences |
| LVMH Moët Hennessy - Louis Vuitton, Société Européenne | 29 | 262 | Home & Lifestyle Products |
| Nestlé S.A. | 24 | 256 | Food & Beverage Producers |
| AstraZeneca PLC | 30 | 240 | Healthcare & Life Sciences |
| L'Oréal S.A. | 23 | 234 | Home & Lifestyle Products |
| Linde plc | 23 | 223 | Chemicals & Commodities |
| McDonald's Corporation | 18 | 194 | Food & Beverage Producers |
| Hermès International S.C.A. | 30 | 191 | Home & Lifestyle Products |
| Reliance Industries Limited | 21 | 186 | Energy Producers & Services |
| HDFC Bank Limited | 23 | 117 | Banking & Lending |
| The Southern Company | 18 | 107 | Utilities & Clean Energy |
| Sanofi | 19 | 105 | Healthcare & Life Sciences |
| Al Rajhi Banking and Investment Corporation | 13 | 102 | Banking & Lending |
| GSK plc | 34 | 99 | Healthcare & Life Sciences |
| Duke Energy Corporation | 19 | 97 | Utilities & Clean Energy |
| AIA Group Limited | 32 | 92 | Insurance & Reinsurance |
| Prosus N.V. | 41 | 92 | Technology Software & Services |
| Marsh & McLennan Companies, Inc. | 11 | 90 | Insurance & Reinsurance |
| Christian Dior SE | 28 | 87 | Home & Lifestyle Products |
| EssilorLuxottica S.A. | 31 | 86 | Healthcare & Life Sciences |
| Vinci S.A. | 27 | 78 | Construction & Engineering |
| Cigna Corporation | 22 | 75 | Healthcare & Life Sciences |
| Chugai Pharmaceutical Co., Ltd. | 31 | 72 | Healthcare & Life Sciences |
| NIKE, Inc. | 36 | 60 | General Retail & Consumer Goods |
| Vale S.A. | 28 | 58 | Construction & Engineering |
| Corteva, Inc. | 26 | 51 | Chemicals & Commodities |
| Hindustan Unilever Limited | 18 | 51 | Home & Lifestyle Products |
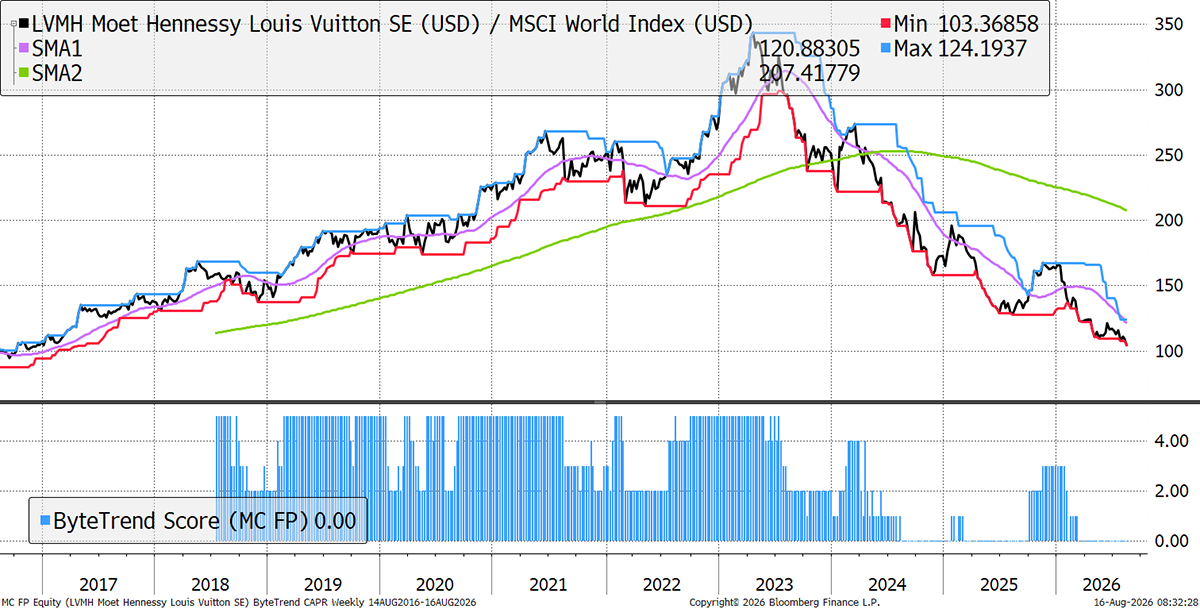
LVMH
The luxury market has bifurcated in recent years. If millionaires buy handbags, billionaires buy jewellery, and it’s only the very top bracket that has been thriving. The millionaire class used to be bolstered by thousands of new members from China each year, but this source of new mid-luxury demand has disappeared, leaving the highly valued luxury stocks like LVMH vulnerable. Sales growth has slowed, record valuations have been questioned, and no answers have satisfied the market as yet.
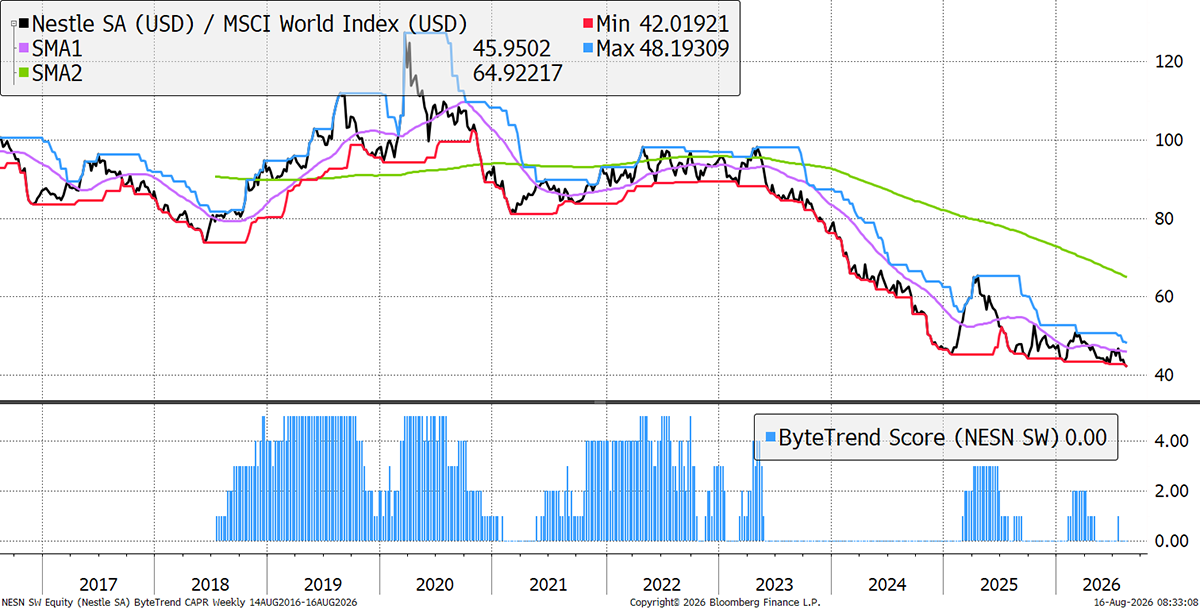
Nestlé
Be careful what you read in the news. One headline immediately after Nestlé’s recent results read, “Net profit declined 31% despite operational improvements”. Many others were similar. The instinctive focus on earnings, or EPS, is overwhelming, but it is wrong. Nestlé has grown free cash flow by 18% in the last 12 months, and the EPS hit was driven by a one-off accounting charge related to the sale of its troubled business in Waters. However, rising cocoa and coffee prices are a threat, as inflation looms large again.
GTI 200 Spreadsheet
We are pleased to share the GTI 200 spreadsheet. Download the spreadsheet below to view the CAPR and local currency scores, and more, for the world’s largest 200 stocks. Have a look at the different groups and the main list “All stocks”. The Insights tab is interesting, and don’t forget to expand the columns by clicking on the “+” at the top of the page if you want to see more trend data.
Outlook
The jaws have been closing in recent months, but we have had a relief rally. However, it’s confined to technology, where most stocks are struggling to make new highs. There is weakness in EM and utilities, which may signal caution in growth, but breadth is strong. Most stocks are rising, but only a few are winning.
Thanks for reading GTI.


