


The AI Bounce Is Over (Already)


Issue 79;
- The Tech Hardware bounce is already over.
- Healthcare stocks got a boost from Moderna.
- Commodities dominate the New Leading Trends.
Looking at the US index, the S&P 500, it is a Bearish Trend. It is making new lows relative to the World Index and is trading below both moving averages, which are also falling. Last week, the S&P fell 1.3%, while the World Index fell by 1.0%.
S&P 500 – Daily
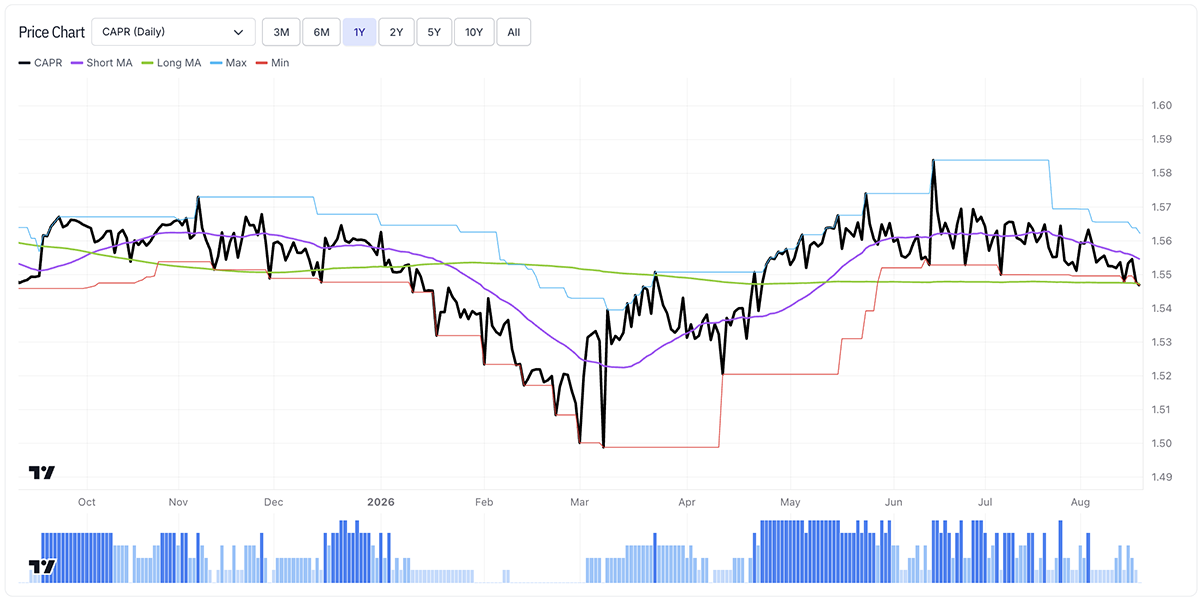
Dollar Weakness Continues
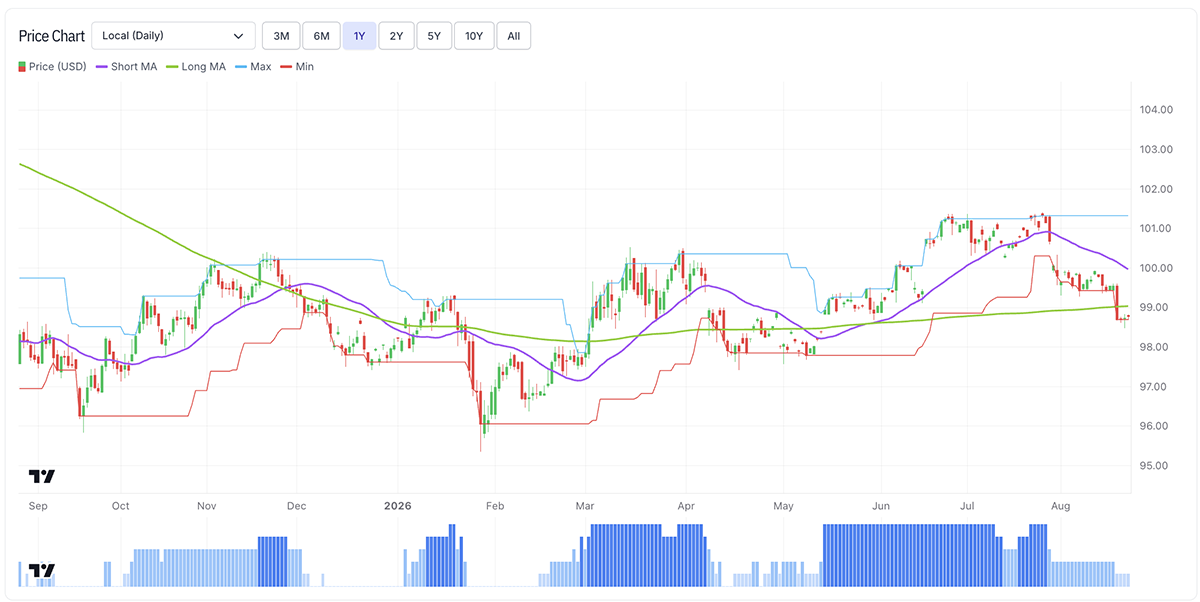
In June and July, the dollar broke out and set new highs, but that has ended. It is back to a score of 1, falling from over 101 to below 99, leading to a strong week for gold and Bitcoin as the debasement trade returned.
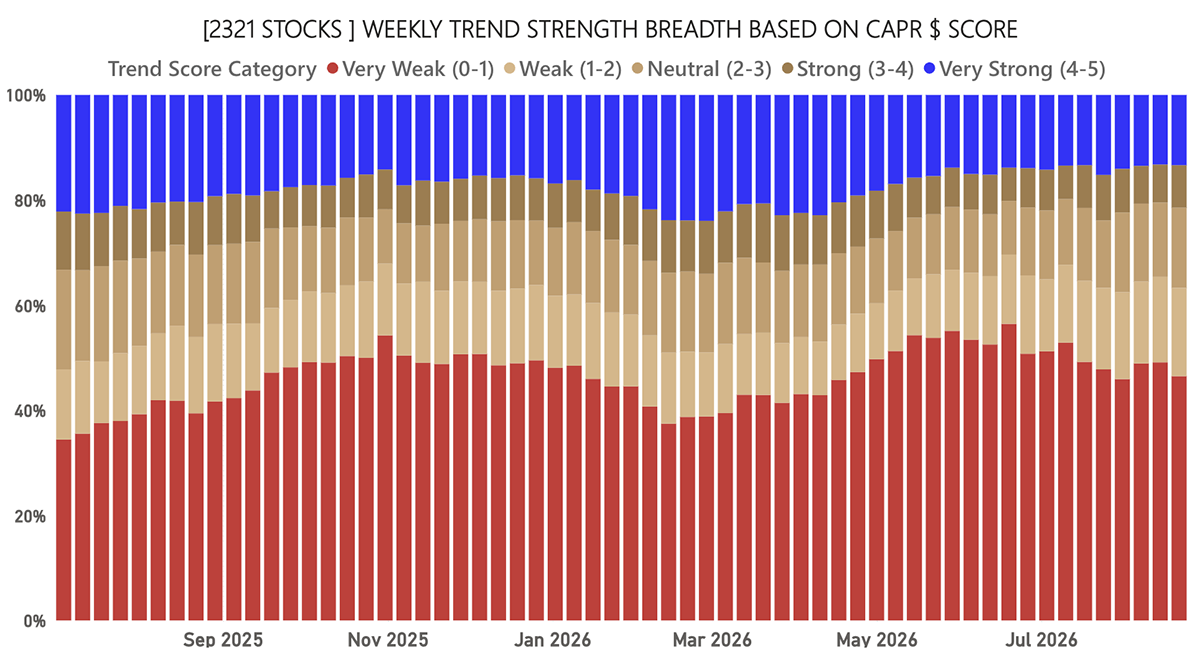
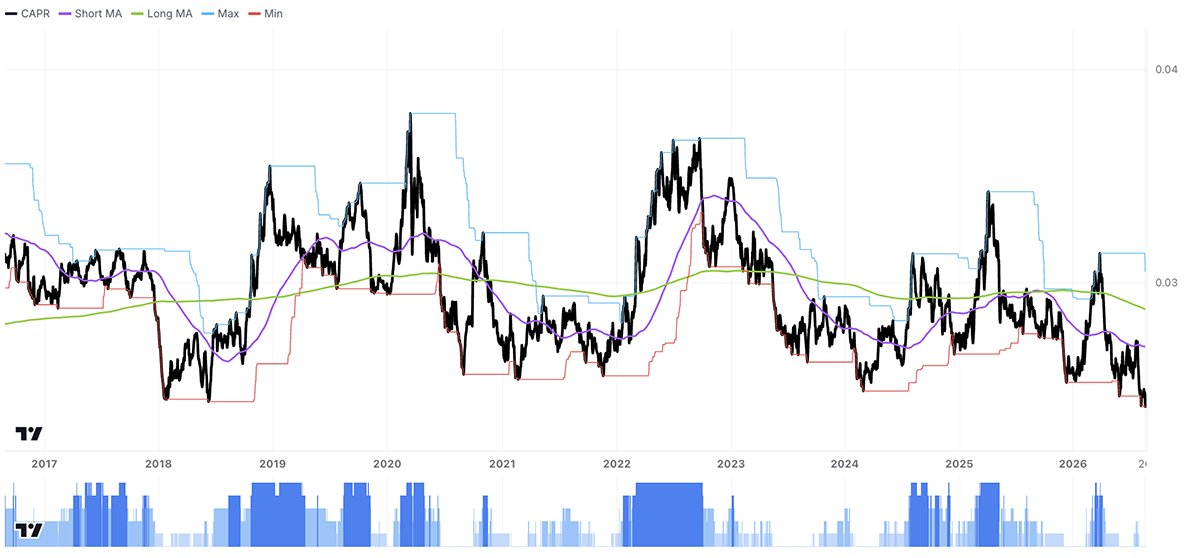
Global Equity Breadth – CAPR
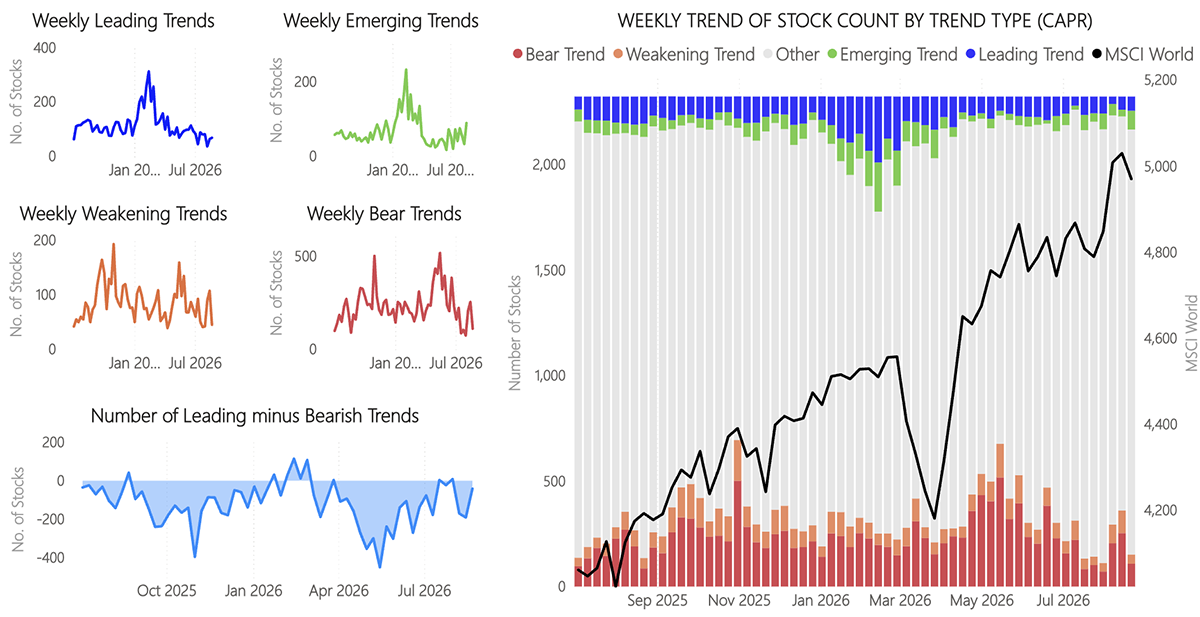
Breadth changed little this week. The number of stocks with strong trends relative to the index (blue) is weak, while the number of stocks getting beaten by the index (red) is high.
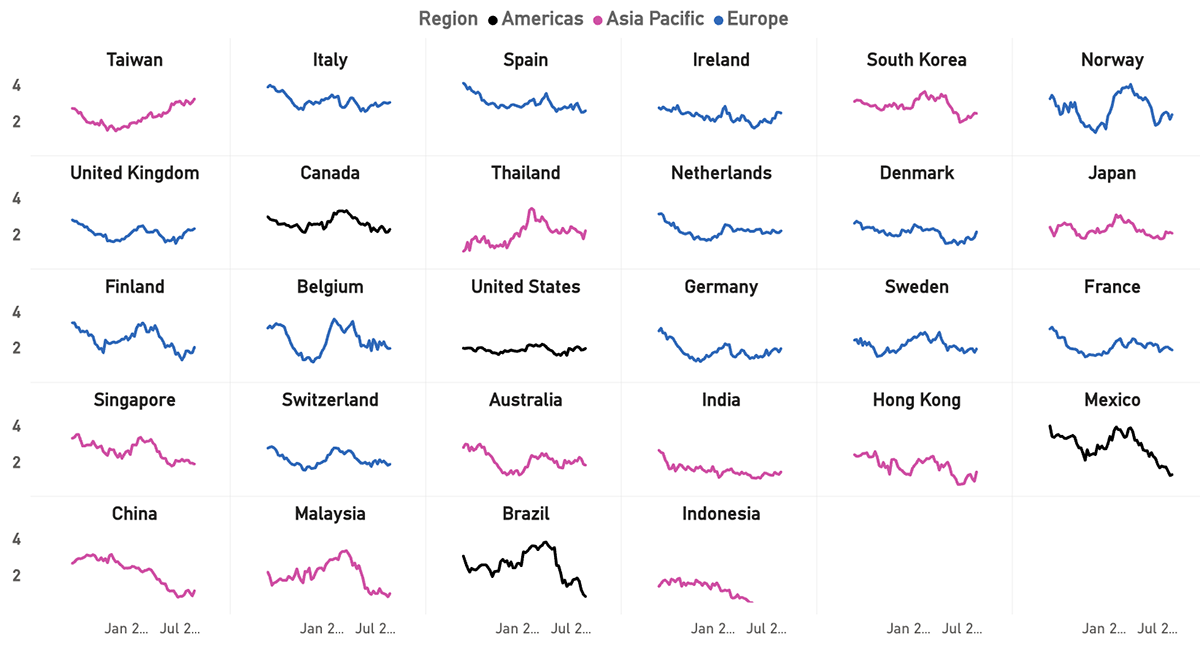
Country Trend Score Analysis
Europe and developed Asian economies lead the way. Emerging Asian and Latin American countries are the weakest, with Mexico and Brazil the recent laggards. Brazil is heading into a contentious election, and fraud at one of its largest banks is hurting trust in the financial system. Finally, Trump has been criticising the central bank’s ubiquitous instant payment system, Pix, probably because it cuts out Visa and Mastercard.
Net Winners - Stay Long Energy, Materials, Financials
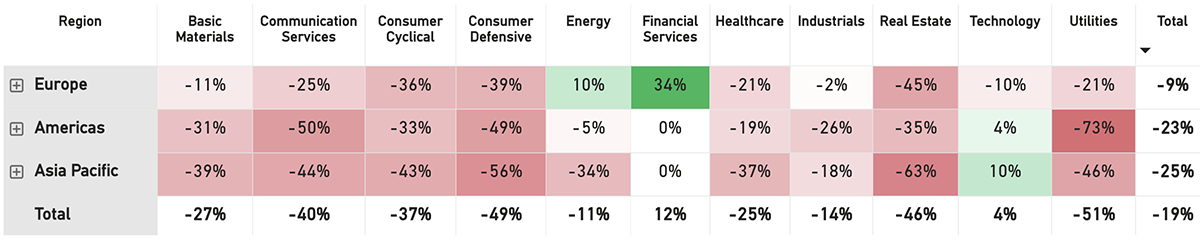
The winners-less-losers metric tells asset allocators which sectors to avoid, and which to focus on. This continues to show how concentrated global alpha is. Only four geographical sectors are delivering outperformance: European Financials and Energy, and Asian/American Technology. Utilities are the weakest sector, especially in the Americas. Real Estate, especially in Asia, remains very weak.
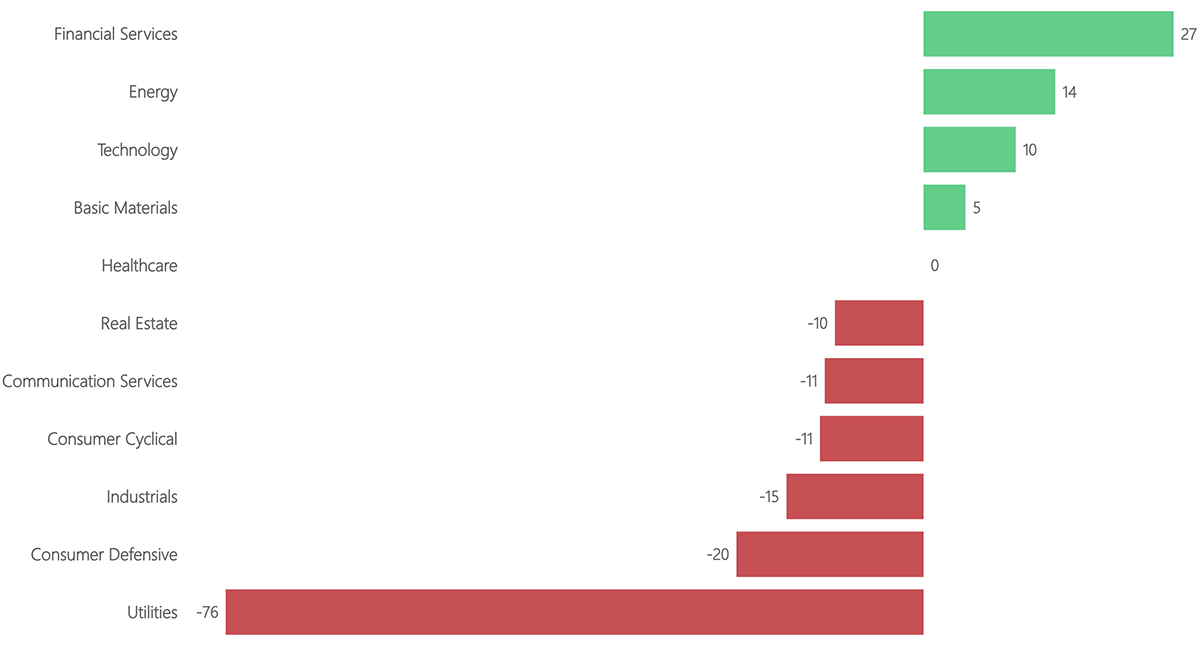
Winners Minus Losers by Sector
This chart shows the number of leading stocks minus bearish trends in each sector, as a percentage. Utilities stand out as the weakest by far, with almost no stocks in a strong trend, and almost all in a weak trend.
Gold’s Comeback Accelerates
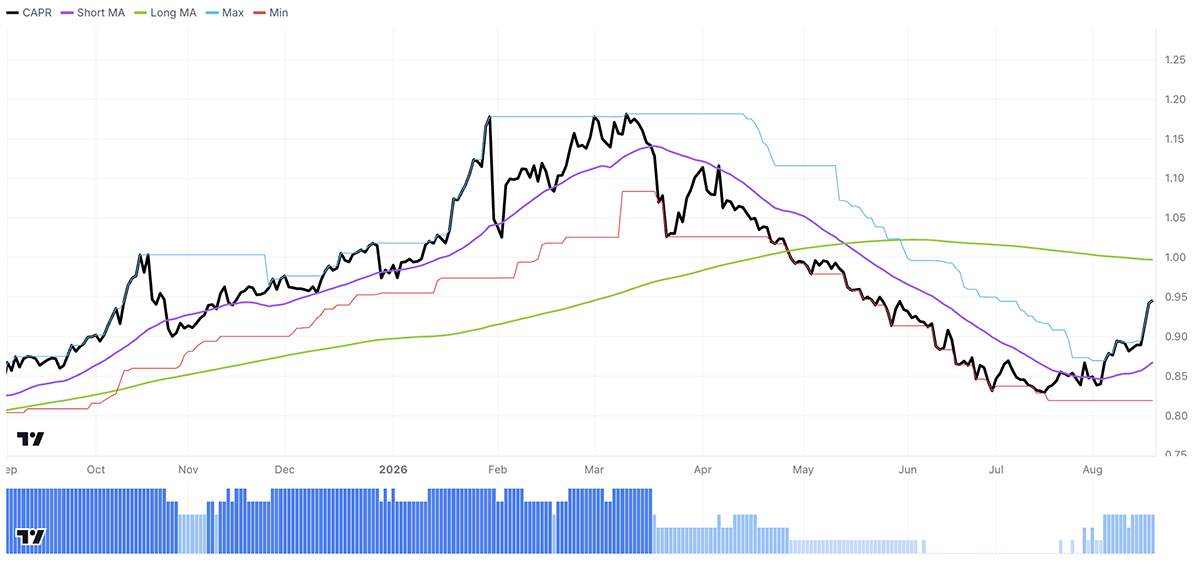
It would be remiss not to mention gold. Its daily CAPR score fell to 0, but it is now making new highs again and trading above a rising 30-day moving average, giving it a score of 3. Scott Bessent’s interventions in the Yen and the US bond market have spooked investors. This was covered in more detail in Atlas Pulse.
Trend Classification, CAPR
This week, there was a notable jump in the number of Emerging trends (green), while Bear and Weakening trends collapsed. Emerging trends are stocks making new relative highs but not yet at a trend score of 5. Stocks need time to reach a score of 5 and become a Leading trend.
The World Index fell during the week, making it easier to beat, and the growth in Emerging trends suggests the rotation from tech hardware into other sectors is continuing.
The Leading trend group is seeing lots of turnover. Last week, AI stocks bounced and rejoined it, but fell out this week, replaced by financials again. The only stocks sticking around in the Leading group are major oil refiners.
Trend Type Performance
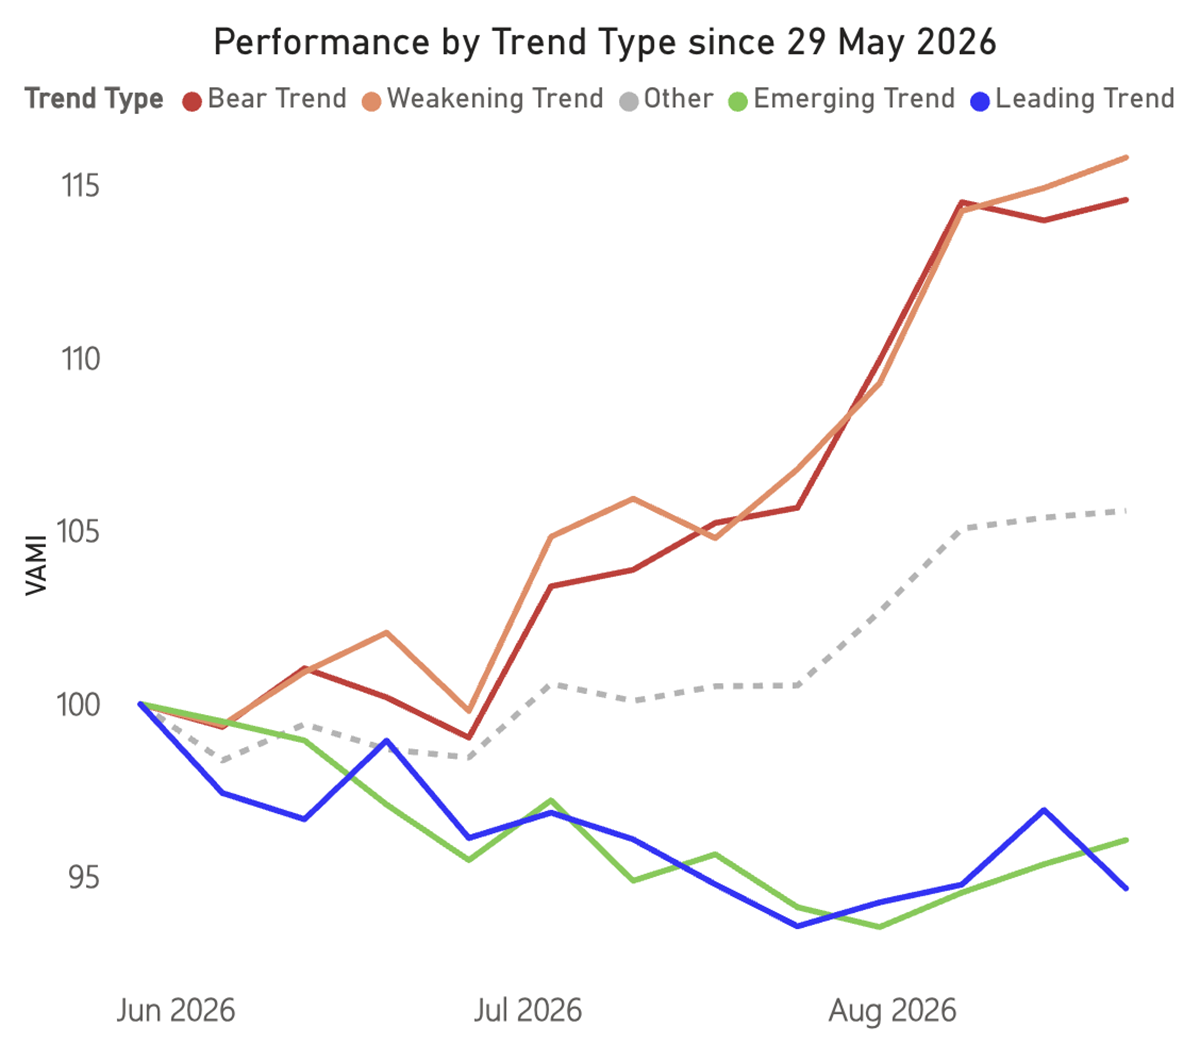
The trend of Bear/Weakening stocks outperforming Leading/Emerging stocks, which began on May 29, continued last week. While stocks in the Leading trends category fell 2.35% on average, the Bear/Weak trends rose by over 0.5%.
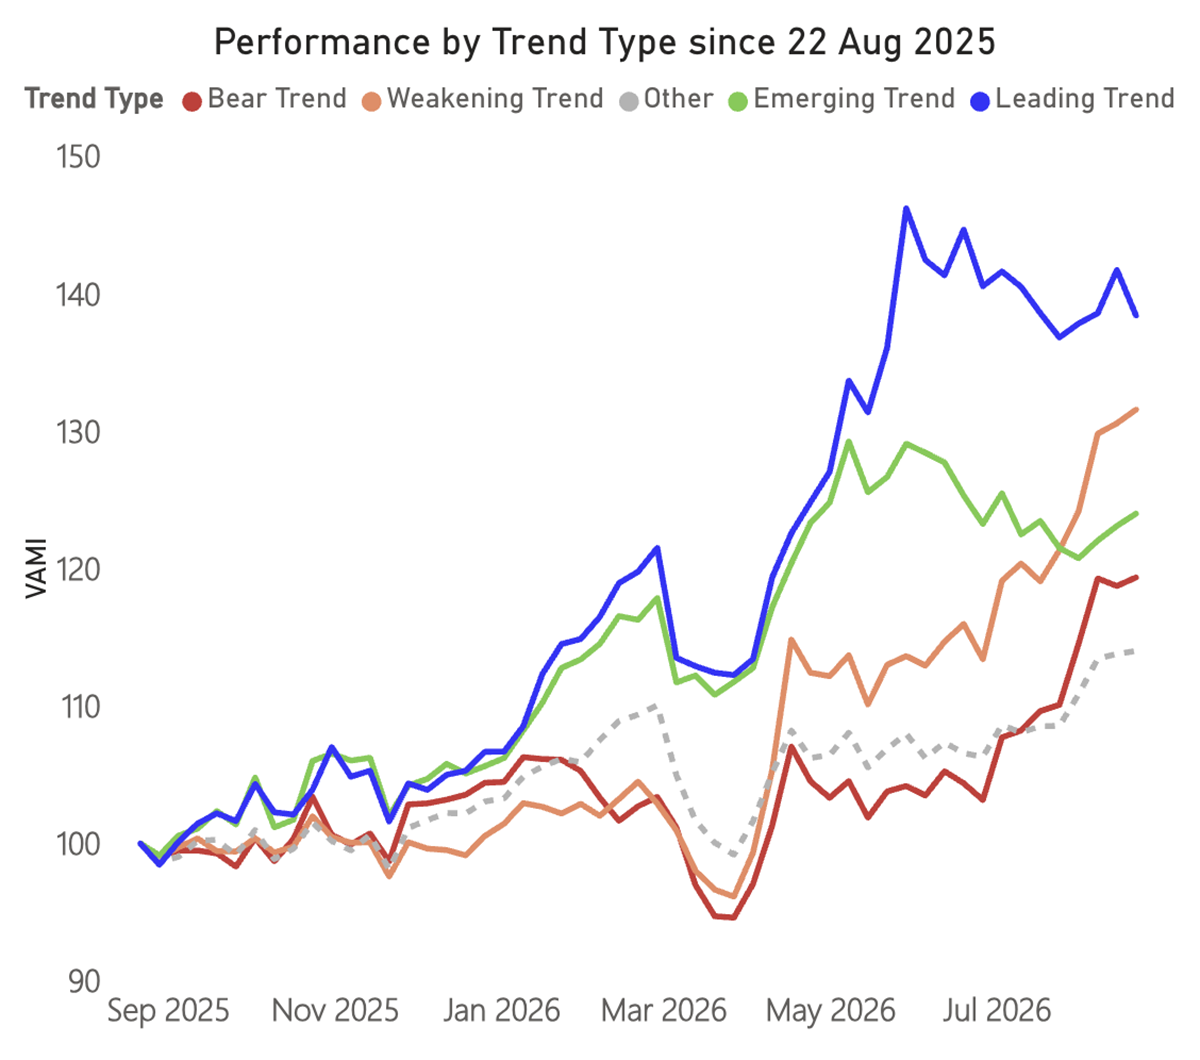
Zooming out, the jaws continue to close, as the Leading Trends’ outperformance has nearly been cancelled out. Trees don’t grow to the sky.
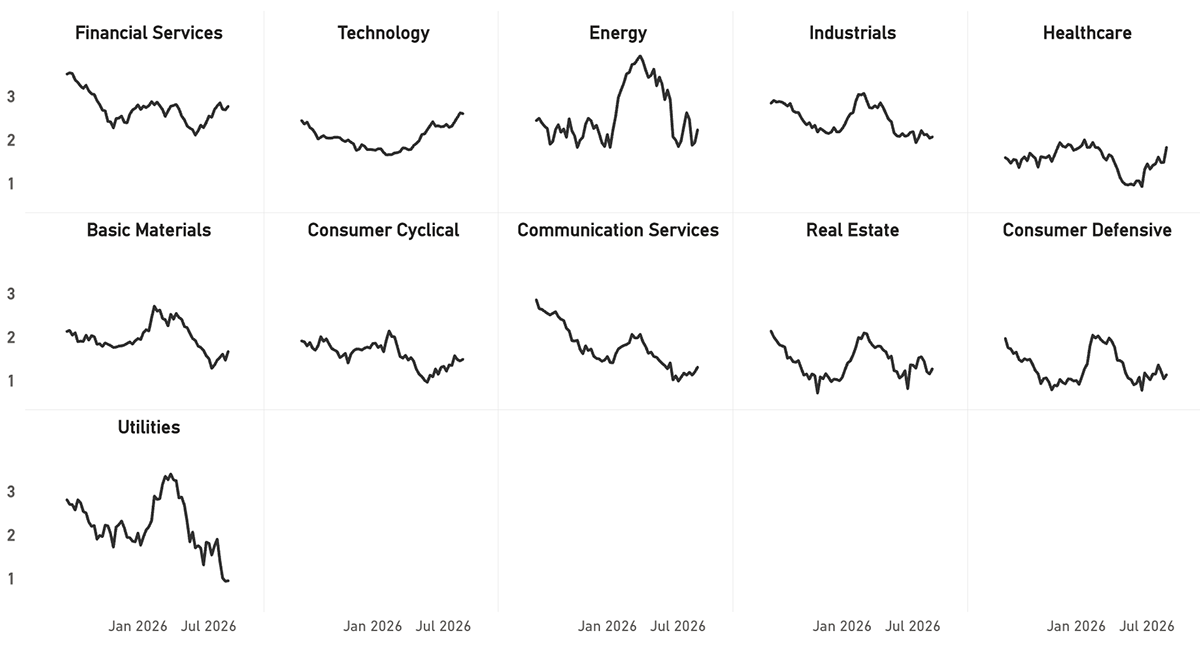
Sector Average CAPR Scores
Financials remain strong, with banking, insurance, and investment stocks all having a good week. Technology looks strong, but under the surface, the hardware-to-software rotation is accelerating. Healthcare is the standout in the table below, jumping sharply, while Utilities have failed to recover from their major slump. US utilities dominate the Bear group this week.
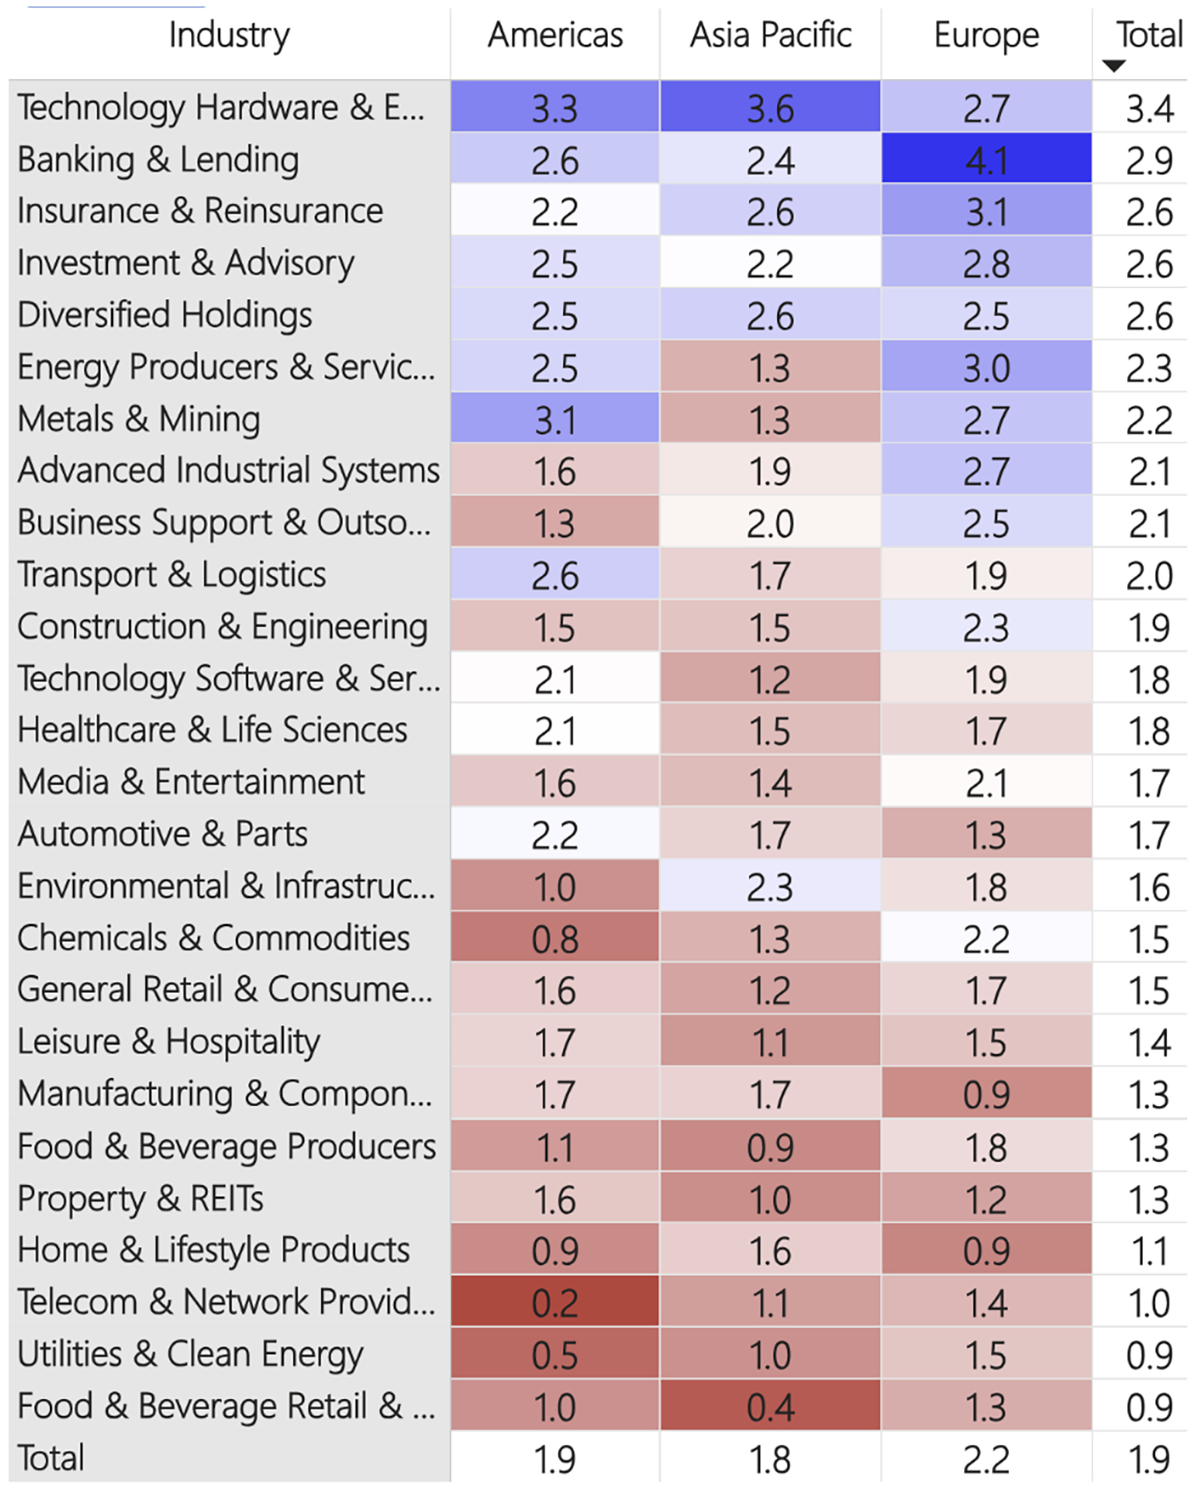
Regions and Industries Average Relative Score
This table (below) shows the average CAPR score for each global industry, by region and in total.
The tech sector rotation has picked up speed. At the start of June, Tech Hardware stocks had an average CAPR score of 4.1. Today, that is 3.4, after another drop last week. They remain the strongest industry, but barely, as last week’s bounce has already faded. The group of stocks - Dell, Palo Alto, Arista, CrowdStrike, Cloudflare, Hewlett Packard, Lenovo, Wiwynn and Advantest – that were leaders last week dropped again.
Advanced Industrials was the only other sector to see a notable drop last week. This group includes aerospace and defence stocks. Construction is also weak, across developed and emerging markets – typically a bad sign for the global economy.
Meanwhile, Tech Software’s remarkable comeback continues. In April, the average CAPR score for a software stock was 0.6; today, it is 1.8. Tech Software is now the 12th-strongest industry, having spent most of the first half of the year at the bottom of the table. This could be a pivotal week, as some of the biggest names report earnings.
Another notable riser last week was Healthcare, boosted by the many positive announcements around cancer drugs (Moderna) and the use of AI in research. Metals & Mining also jumped, following a weaker period, as gold prices rallied hard.
Although Consumer Defensives are showing some promise more broadly, Food & Beverage retailers remain very weak. This includes well-loved stocks like Walmart and Costco, which are richly valued. Food & Beverage Producers are the staple stocks with big brands that have generally lower valuations, and are therefore benefitting from the rotation in markets.
User Guide
Refer to our GTI: User Guide for an overview of the key concepts and terminology used in this report. These concepts may take a little bit of getting used to, but they are very powerful once you do.
Leading Trends with New Highs
These stocks are trading at the 30-week CAPR highs with a ByteTrend Score of 5. All charts shown are CAPR rebased to 100.
| Name | Annual Vol 30w | Mkt Cap $Bn | Industry |
| Allianz SE | 21 | 196 | Insurance & Reinsurance |
| DBS Group Holdings Ltd | 15 | 170 | Banks |
| Banco Bilbao Vizcaya Argentaria, S.A. | 29 | 160 | Banking & Lending |
| Oversea-Chinese Banking Corporation Limited | 18 | 110 | Banking & Lending |
| Marathon Petroleum Corporation | 46 | 105 | Energy Producers & Services |
| Valero Energy Corporation | 40 | 100 | Energy Producers & Services |
| Phillips 66 | 39 | 97 | Energy Producers & Services |
| WuXi AppTec Co., Ltd. | 42 | 76 | Healthcare & Life Sciences |
| KBC Group N.V. | 22 | 61 | Banking & Lending |
| Erste Group Bank AG | 32 | 55 | Banking & Lending |
| ArcelorMittal S.A. | 44 | 55 | Metals & Mining |
| Nanya Technology Corporation | 84 | 51 | Technology Hardware & Equipment |
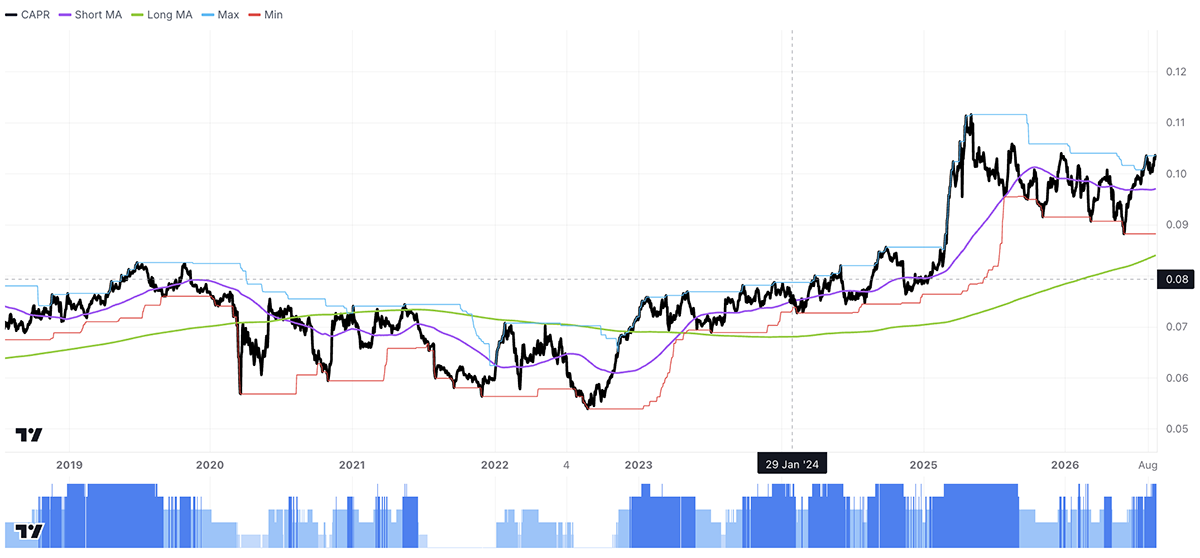
Allianz SE
Allianz SE is a large German insurer and asset manager. It makes money from property and casualty, and life and health insurance, as well as asset management, through Allianz Global Investors and PIMCO. Its capital ratios are strong and operating profits rose 9% in Q2, while its assets under management grew 7% thanks to record inflows.
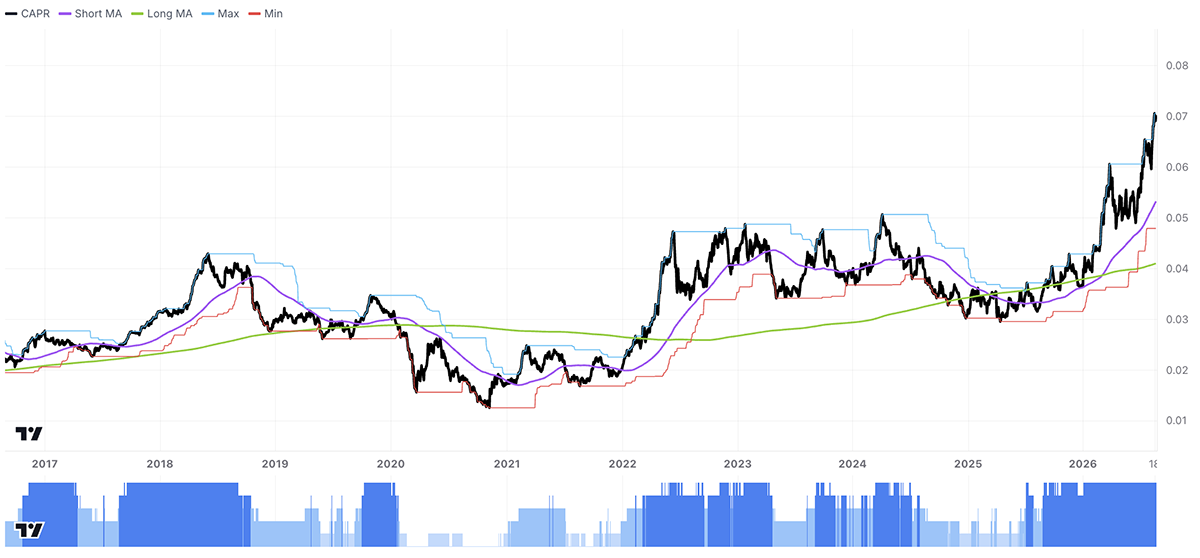
Valero
US oil refiner Valero is benefitting, alongside its peers, from record-breaking refining margins, as the price of oil products (petrol, diesel, jet fuel) relative to crude oil is wider than ever before. The diesel spread has been especially wide in August. Valero’s operating margins in Q2 were double those of last year.
New Leading Trends
These stocks are trading at the 30-week CAPR highs with a ByteTrend Score of 5, except they are new trends this week, having previously had a score below 5. All charts shown are CAPR rebased to 100.
| Name | Annual Vol 30w | Mkt Cap $Bn | Industry |
| BHP Group Limited | 31 | 238 | Construction & Engineering |
| Freeport-McMoRan Inc. | 52 | 110 | Metals & Mining |
| Grupo México, S.A.B. de C.V. | 37 | 109 | Construction & Engineering |
| argenx SE | 45 | 66 | Healthcare & Life Sciences |
| Targa Resources Corp. | 33 | 64 | Energy Producers & Services |
| CEZ, a. s. | 22 | 36 | Utilities & Clean Energy |
| Repsol, S.A. | 37 | 36 | Energy Producers & Services |
| COSCO SHIPPING Holdings Co., Ltd. | 32 | 35 | Transport & Logistics |
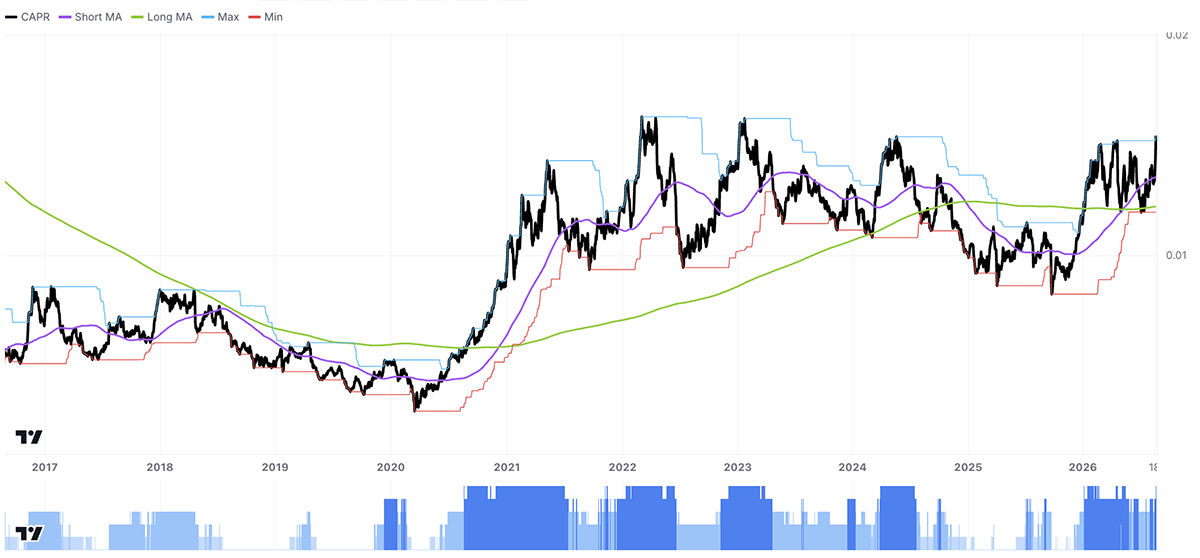
Freeport-McMoran
Copper prices are making new highs and are in a strong, long-term uptrend. Freeport is one of the world’s largest copper miners and also produces gold. Its main operations span the US, Peru, and Indonesia, where its Grasberg mine is expected to ramp up to full capacity by the end of 2027 after a mudslide last year.
Emerging Trends
These stocks are trading at the 30-week CAPR highs with a ByteTrend Score of less than 5. They don’t have to be in an uptrend, just emerging. All charts shown are CAPR rebased to 100.
| Name | Annual Vol 30w | Mkt Cap $Bn | Industry |
| Palantir Technologies Inc. | 78 | 413 | Technology Software & Services |
| The Coca-Cola Company | 20 | 392 | Food & Beverage Producers |
| Merck & Co., Inc. | 35 | 377 | Healthcare & Life Sciences |
| Amgen Inc. | 29 | 237 | Healthcare & Life Sciences |
| Vertex Pharmaceuticals Incorporated | 28 | 139 | Healthcare & Life Sciences |
| Snowflake Inc. | 85 | 115 | Technology Software & Services |
| Automatic Data Processing, Inc. | 33 | 112 | Technology Software & Services |
| Airbnb, Inc. | 36 | 111 | Leisure & Hospitality |
| Ferrari N.V. | 34 | 76 | Automotive & Parts |
| Target Corporation | 31 | 75 | Food & Beverage Retail & Distribution |
| Cenovus Energy Inc. | 39 | 61 | Energy Producers & Services |
| Anglo American plc | 38 | 59 | Construction & Engineering |
| Moderna, Inc. | 183 | 58 | Healthcare & Life Sciences |
| PayPal Holdings, Inc. | 54 | 53 | Banking & Lending |
| Workday, Inc. | 64 | 52 | Technology Software & Services |
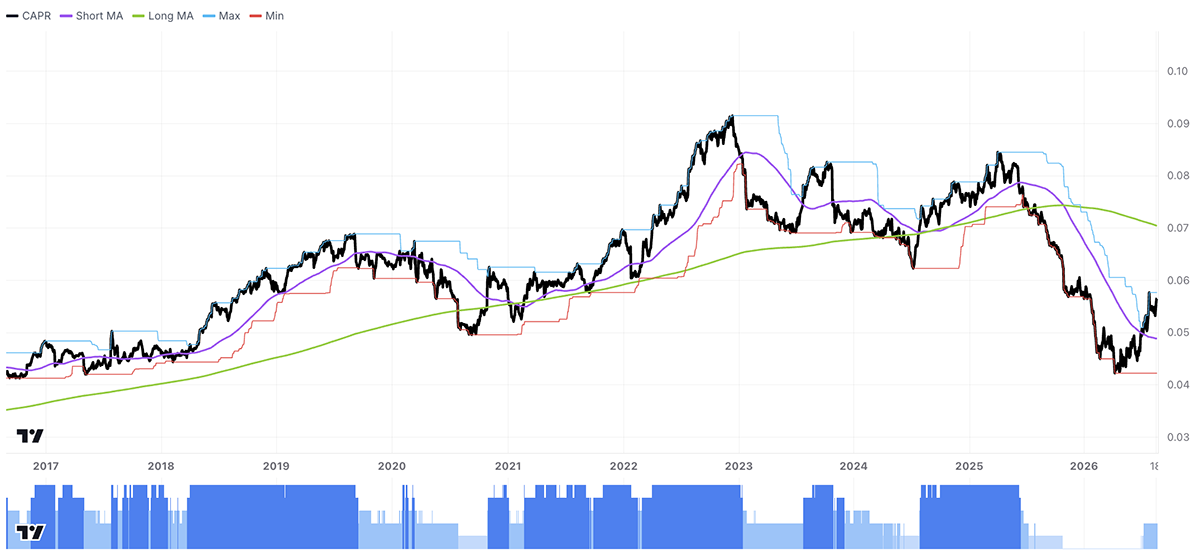
ADP
ADP runs the human resources and payroll software for millions of companies worldwide. It has been around since 1949, and is resilient because payroll is an essential part of every single business’ operations. Notably, 92% of revenue is recurring, so ADP essentially grows with the global economy. It sold off hard in the so-called “SaaSpocalypse”, when AI disruption fears hit the software sector, but is among the most resilient software stocks.
Moderna
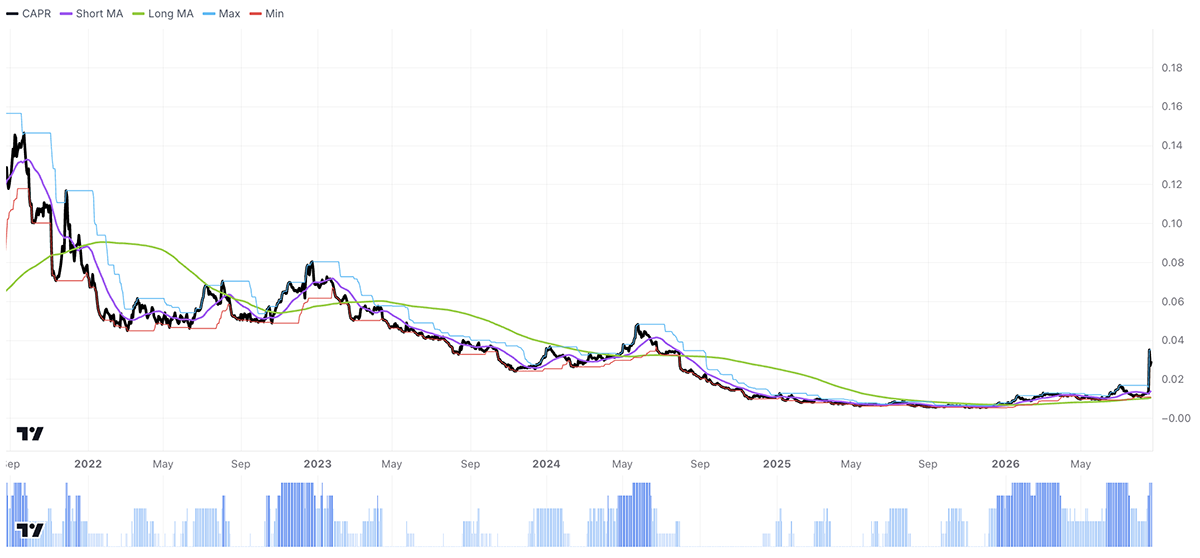
Here we see the 5-year chart instead of the 10-year, as Moderna was listed in 2018. It rose 220% on Thursday, after announcing the first-ever successful phase 3 trial results for their treatment against melanoma. The key factor is that it can tailor the vaccine to the specific patient. The results validated their mRNA platform and suggested that cancer vaccines may indeed be possible.
Weakening
These stocks are trading at the 30-week CAPR lows with a ByteTrend Score above 0. They are weakening trends but not yet downtrends. All charts shown are CAPR rebased to 100.
| Name | Annual Vol 30w | Mkt Cap $Bn | Industry |
| Meta Platforms, Inc. | 47 | 1401 | Technology Software & Services |
| Walmart Inc. | 30 | 825 | Food & Beverage Retail & Distribution |
| The TJX Companies, Inc. | 24 | 155 | General Retail & Consumer Goods |
| AppLovin Corporation | 75 | 103 | Technology Software & Services |
| Trane Technologies plc | 30 | 100 | Construction & Engineering |
| Cummins Inc. | 32 | 81 | Construction & Engineering |
| TransDigm Group Incorporated | 31 | 67 | Advanced Industrial Systems |
| TC Energy Corporation | 26 | 65 | Energy Producers & Services |
| CRH plc | 34 | 64 | Construction & Engineering |
| Loblaw Companies Limited | 24 | 51 | Food & Beverage Retail & Distribution |
Walmart
Walmart is a great company, famous for its resilience during the 2008 financial crisis. The argument goes that it is recession-proof because richer consumers downgrade to shop there in tough times, offsetting some of the difficulty. However, it started 2007 trading at 10x earnings, and earlier this year, it reached 50x. Starting valuations matter hugely, and it just reported its slowest same-store growth in six years.
CRH
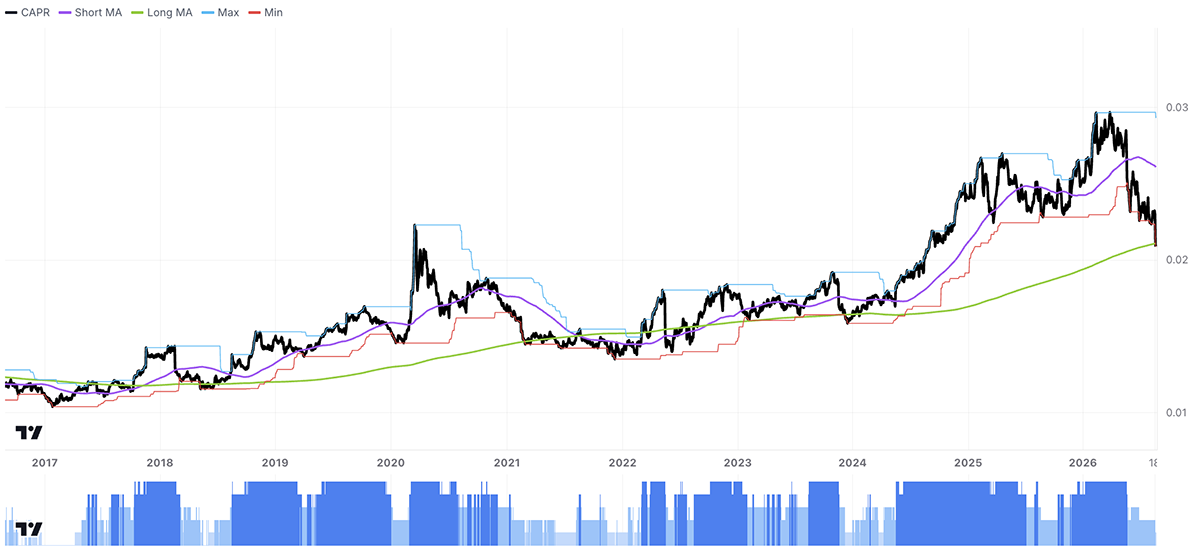
CRH is a global building-materials company. Its results have been strong, but investors are worried by softening residential demand (driven by high mortgage rates) and its $8.5bn acquisition of Arcosa Inc. The threat of higher inflation impacting demand has added another layer of concern since the Iran War began.
Bear Trends
These stocks are trading at the 30-week CAPR lows with a ByteTrend Score of 0. They are in a downtrend. All charts shown are CAPR rebased to 100.
| Name | Annual Vol 30w | Mkt Cap $Bn | Industry |
| NextEra Energy, Inc. | 18 | 174 | Utilities & Clean Energy |
| The Boeing Company | 35 | 169 | Advanced Industrial Systems |
| The Southern Company | 19 | 102 | Utilities & Clean Energy |
| Duke Energy Corporation | 19 | 93 | Utilities & Clean Energy |
| Westpac Banking Corporation | 22 | 83 | Banking & Lending |
| Cigna Corporation | 22 | 73 | Healthcare & Life Sciences |
| Honeywell International Inc. | 30 | 68 | Diversified Holdings |
| American Electric Power Company, Inc. | 26 | 66 | Utilities & Clean Energy |
| Sempra | 24 | 54 | Utilities & Clean Energy |
The Southern Company
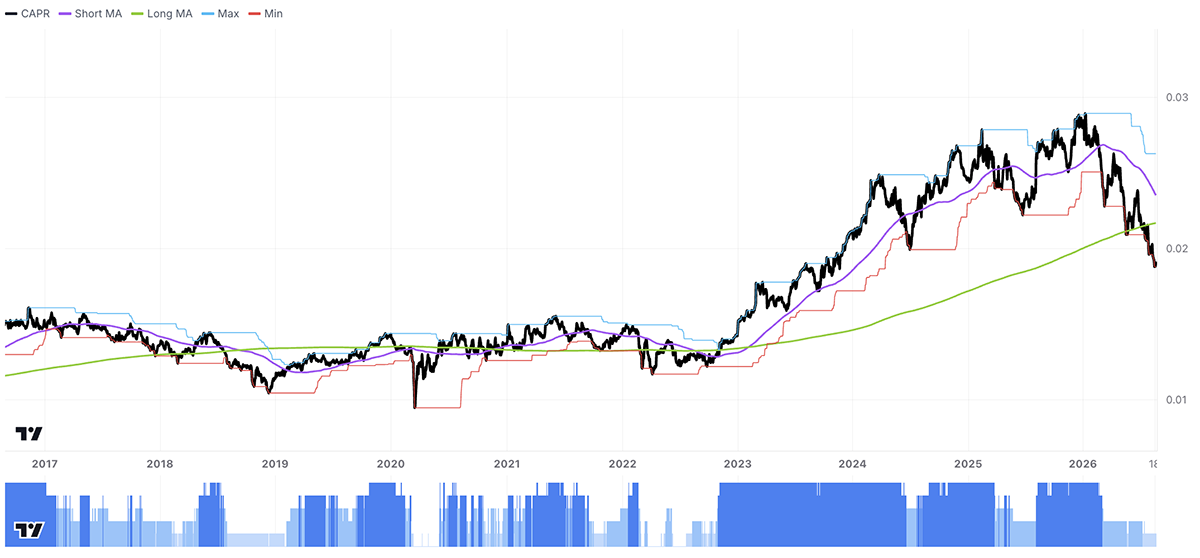
The first of two utilities, Southern traded at an average sales multiple of 2.7x between 1990 and 2010. Today, it trades at 6x. Rising power prices in America, driven by grid upgrades and surging demand from data centres, turned these usually defensive stocks into AI trades, pushing them far beyond their usual valuation ranges. Now we are seeing the result: higher rates are denting their relative appeal, and valuations are beginning to normalise. Southern needs to raise lots of capital to fund the expansion needed for the electrified, AI era.
Duke Energy
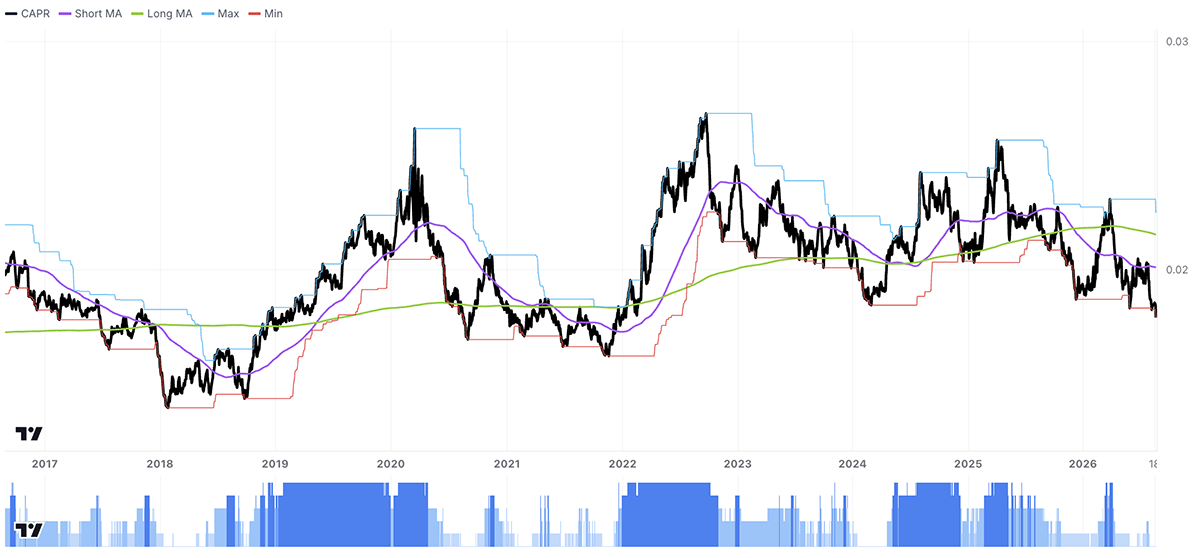
At Duke, the story is similar. It will need to raise significant capital to finance the data centre expansion and grid upgrades required. Operations are strong, but high valuations mixed with financing concerns, in a high-rate environment, are driving the stock lower. Investors fear dilution and a growing interest burden. They are focused on the balance sheet, not the earnings.
GTI 200 Spreadsheet
We are pleased to share the GTI 200 spreadsheet. Download the spreadsheet below to view the CAPR and local currency scores, and more, for the world’s largest 200 stocks. Have a look at the different groups and the main list “All stocks”. The Insights tab is interesting, and don’t forget to expand the columns by clicking on the “+” at the top of the page if you want to see more trend data.
Outlook
The rotation from hardware into software and defensives resumed this week following the recent bounce in the AI trade. Weakness in construction and developing economies signals potential trouble for the global economy.
Thanks for reading GTI.


